Investigating An Unbalanced Net Torque
We started by looking at the fact that a disk experiencing a net unbalanced torque also experienced a change in rotational or angular velocity. The students used a rotary motion sensor to measure the angular position and the angular velocity of a disk experiencing a constant torque and the students immediately recognized the similarity between a particle experiencing constant linear acceleration and a rigid body experiencing constant angular acceleration.

So, the natural next step in our investigation was to determine the causal relationship between a net unbalanced torque and the angular motion state of a rigid body. The students discussed how we might set up an investigation that would help us understand this relationship, and I helped guide them towards a final investigation design where we used a rotary motion sensor attached to the wooden disk we had used in a previous investigation.
The rotary sensors from Vernier are rather expensive, but also quite nice. They come with a plastic spindle with three different pulley radii. The only issue that I have with these is that they do not include a useful screw for attaching objects to the pulley – they expect you to purchase their completely over priced accessory kit. I don’t suggest this. Instead, you can create your own and then use a 6/32 screw to attach them to the pulley – just be careful not strip the threads!

Working off a similar investigation when studying the causal relationship between a net unbalanced force and linear acceleration, the students recognized that we needed to include a force sensor for measuring the applied force. The students then had LoggerPro plot the points for the calculated torque (using a calculated column) and the measured angular acceleration. The data isn’t super clean, but its good enough for the students to conclude that the relationship is most likely linear.
Dimensional Analysis – Inferring Rotational Inertia
I was amazed to discover that some students in the class set off to understand what the units of the slope could be reduced to. They immediately saw that the proportional constant (slope) included kg (mass) but that wasn’t all. After some work, the class had determined that the units for the slope were kg * m^2.
This led to a qualitative discussion about the inertia of rotating objects. We discussed hoops and disks primarily, and the class seemed to agree that the units made sense. Although I didn’t have any hoop-disk sets like the ones you can buy from various vendors, we did perform some thought experiments around mass distribution and rotation, but we needed to be sure that we were on the right track.
A Better Variable Inertia Disk
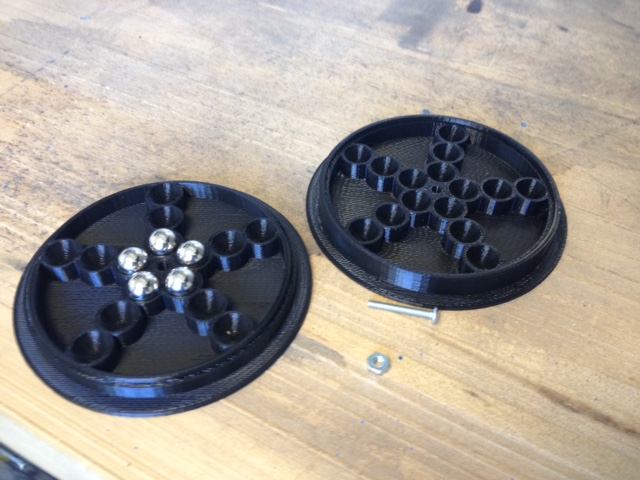
So last year I was looking for an investigation that would really help the students discover the importance of mass distribution for a rotating object. Reading the material on the AMTA website regarding the unit on rotational motion, the researches stressed the importance of connecting mass distribution to the rotational inertia. I found this variable inertia disk from Fischer Scientific and decided to purchase it. I commend these guys on making this, but frankly I decided that I could make a better one.
My colleague and I set about redesigning these disks. The improvements we made included a) better compartments for the metal marbles so that they didn’t move around, b) an index and lip so that the two sides fit more securely together, and c) more compartments so that we can test more mass configurations. After we made our designs, we used our Makerbot 3D printer to print out ten copies of the disks.

With these disks attached to the rotary motion sensors, the students were able to confirm that although the total mass of the disk did not change, the angular acceleration declined as the mass was moved outward from the radius of rotation. This was more of a qualitative investigation, but I think the students were able to clearly see how moving the mass farther from the axis affected the rotational inertia of the disk.
Deploying The Model (So far)
Now that the students had built a predictive model that described the quantitative relationship between rotational inertia, angular acceleration and net torque, they were ready to test it.
We returned to the investigation setup with the disk, but this time attached a hanging mass to the string and they attempted to predict the angular acceleration. The students immediately made the mistake (as I thought they might) in considering only the disk in the system. This gave me a chance to review with them the following process:
- Identify the system schema (now it includes things that can rotate!)
- Draw your force vector (free body/particle) diagrams and now also your force-moment arm (rigid body) diagrams.
- Write the summation of forces AND the summation of torques for the system.
- Do some algebra.
The trickiest part to figuring this out is getting the signs right due to interaction pairs and making sure that they agree. I ask the students to start with a diagram and then go through and label each force + or – by picking a force and then finding its partner and then making sure that the rest of the force directions agree.
Once they were able to get a prediction that we all agreed seemed correct, they ran the experiment. The class was able to predict the angular acceleration within about 10% error. We discussed the possible reason for discrepancy which led to some interesting discussions around modeling the rotational inertia of the attachment screw and washer, and also the frictional forces at work.
The students were pretty convinced that the model worked, and so next stop – energy and momentum in systems with rotational motion.

Pingback: Building The Net Torque Model – Part 3 | Academy of Physics and Technology