Our Custom Designed Bridge Tester

Our Goal – Make A Better Bridge Crusher!

This year Bob and I decided to upgrade our bridge project. We wanted to create an improved device for measuring the load on the model bridges created by the students. Specifically, we wanted to design a way for the students to collect meaningful performance data.

The problem with our old method (filling a bucket with sand until the bridge catastrophically failed) was that it didn’t allow for the students to collect evidence about where and why the bridge failed. In many cases, the bridge actually experienced a significant failure, but because the bridge collapsed around the loading plate, the loading plate actually acted as a support for the bridge.

We had seen other “bridge testers” from vendors (http://www.pitsco.com/Structures_Testing_Instrumenthttp://kelvin.com/kelvin-bridge-material-tester-w-cpad/http://www.vernier.com/products/sensors/vsmt/) but we had the idea that perhaps we could create one that might be better, or at least it might be fun to try. In this post, we are going to share with you what we created and why we think it actually turned out really well, but we also point out some room for improvement.

The Frame

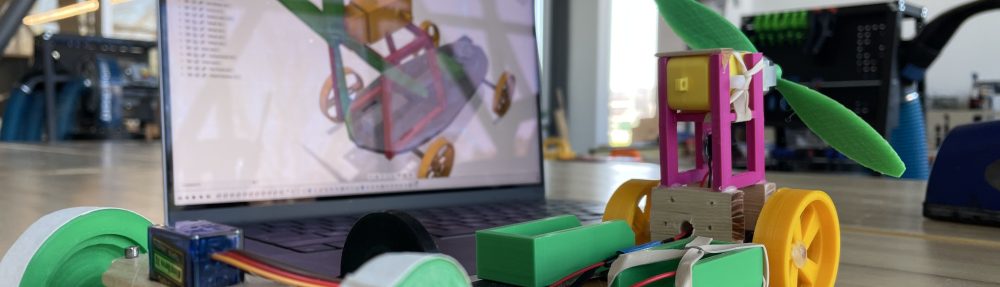
The frame of the entire device is really based on the Vernier Structures and Materials Tester. We thought this frame was probably the best, and we wanted to make our tester from extruded aluminum tubing as well. We went about designing the bridge tester in our favorite CAD program, Fusion360 by Autodesk. We sent our CAD file to the company 8020 and they precut all our t-slotted aluminum frame members to size. This was awesome because it made assembly super easy and it saved us on shipping too! Our experience with this company was amazing – they were super helpful and even gave us some really helpful advice. If you are thinking about making anything requiring t-slotted aluminum, definitely order from them.

The Load Sensors

We wanted a a bridge tester that actually gave us data that allowed us to figure out how and why the student bridges failed. That meant that we needed more data and we needed data that could be connected to the design and fabrication of the bridge. We noticed that all the vendors’ designs had only one load sensor, and some also had a way to detect overall deflection. We suspected that we could get better data if we had four independent load sensors – one for each abutment where the bridges were supported. The four sensors would (theoretically) give the students a way to analyze how the load was being distributed, and thus tell us something about the torsional behavior of the bridge.

Sparkfun load sensor

Sparkfun load sensor

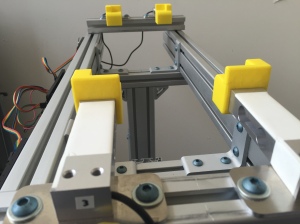
I set out to learn a bit about load sensors and I came across a fantastic tutorial at Sparkfun (https://learn.sparkfun.com/tutorials/getting-started-with-load-cells). We ordered four load sensors (see picture above) from Sparkfun. Our design (shown below) has the four load sensors  fitted with 3D printed “shoes” as the bridge abutments.

IMG_3048

The four load cells.

IMG_3044

Two load cells with abutments.

The sensors are mounted on custom fabricated aluminum plates that can be moved laterally to accommodate slightly different bridge widths. The load sensors had to be connected to load amplifiers that were then connected to an Arduino (more on that below). The load sensors were mounted to the frame of the bridge tester on custom laser cut plates:

IMG_3043

Load cell amplifiers for two load cells.

The load amplifiers have to be used with the load sensors in order to amplify the signal so that the Arduino can read the data correctly.

The Loading Mechanism

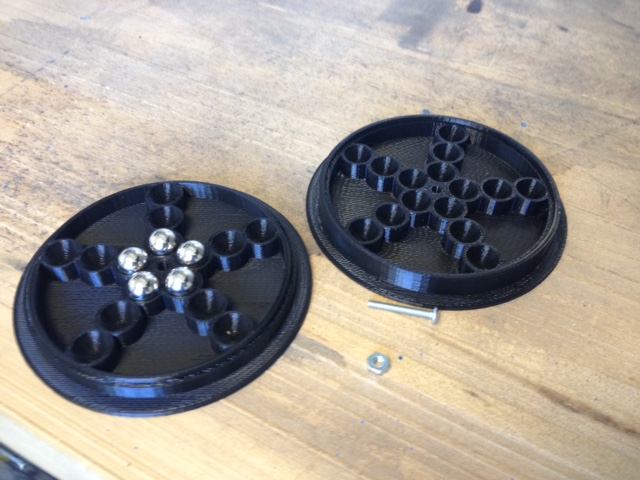
Bob designed and fabricated the loading mechanism that was based on many of the designs we had seen online. It consists of a block that is free to move vertically up or down a threaded rod which is then connected to a spoked wheel.

IMG_3047

Loading wheel.

When the wheel is turned, the block moves up or down the threaded rod. This bar is connected to a loading plate via a metal cable that hooks into the loading plate and the block:

IMG_3053

Load plate from below – revealing loading wire attachment.

IMG_3052

Loading wire attached to threaded block.

The loading plate is placed on the loading plane of the bridge (the “roadway”), and then the bridge is loaded by spinning the wheel, which lowers the block, which pulls the bridge downwards:

IMG_3050

Loading plate on bridge.

Collecting The Data: The Software

 The software responsible for collecting the data is made up of two programs – one that runs on the Arduino micro-controller that is connected to the load sensors, and the other is a Processing sketch that runs on a computer/laptop connected to the Arduino via USB. The code is pretty simple, and it was mostly written using code from other sources and then modified for our specific purposes.

The Arduino code just collects the data from the four load sensors and then sends the data serially as a comma delimited package. The Processing code reads the serial port and then essentially dumps the data into a csv file. It does have some flourishes like a graphical display of the individual sensor loads as well as a display of the total load and whether or not the bridge has met the minimum load requirement set in the project descriptor.

You can view and download all the code here on GitHub.

The Performance Report

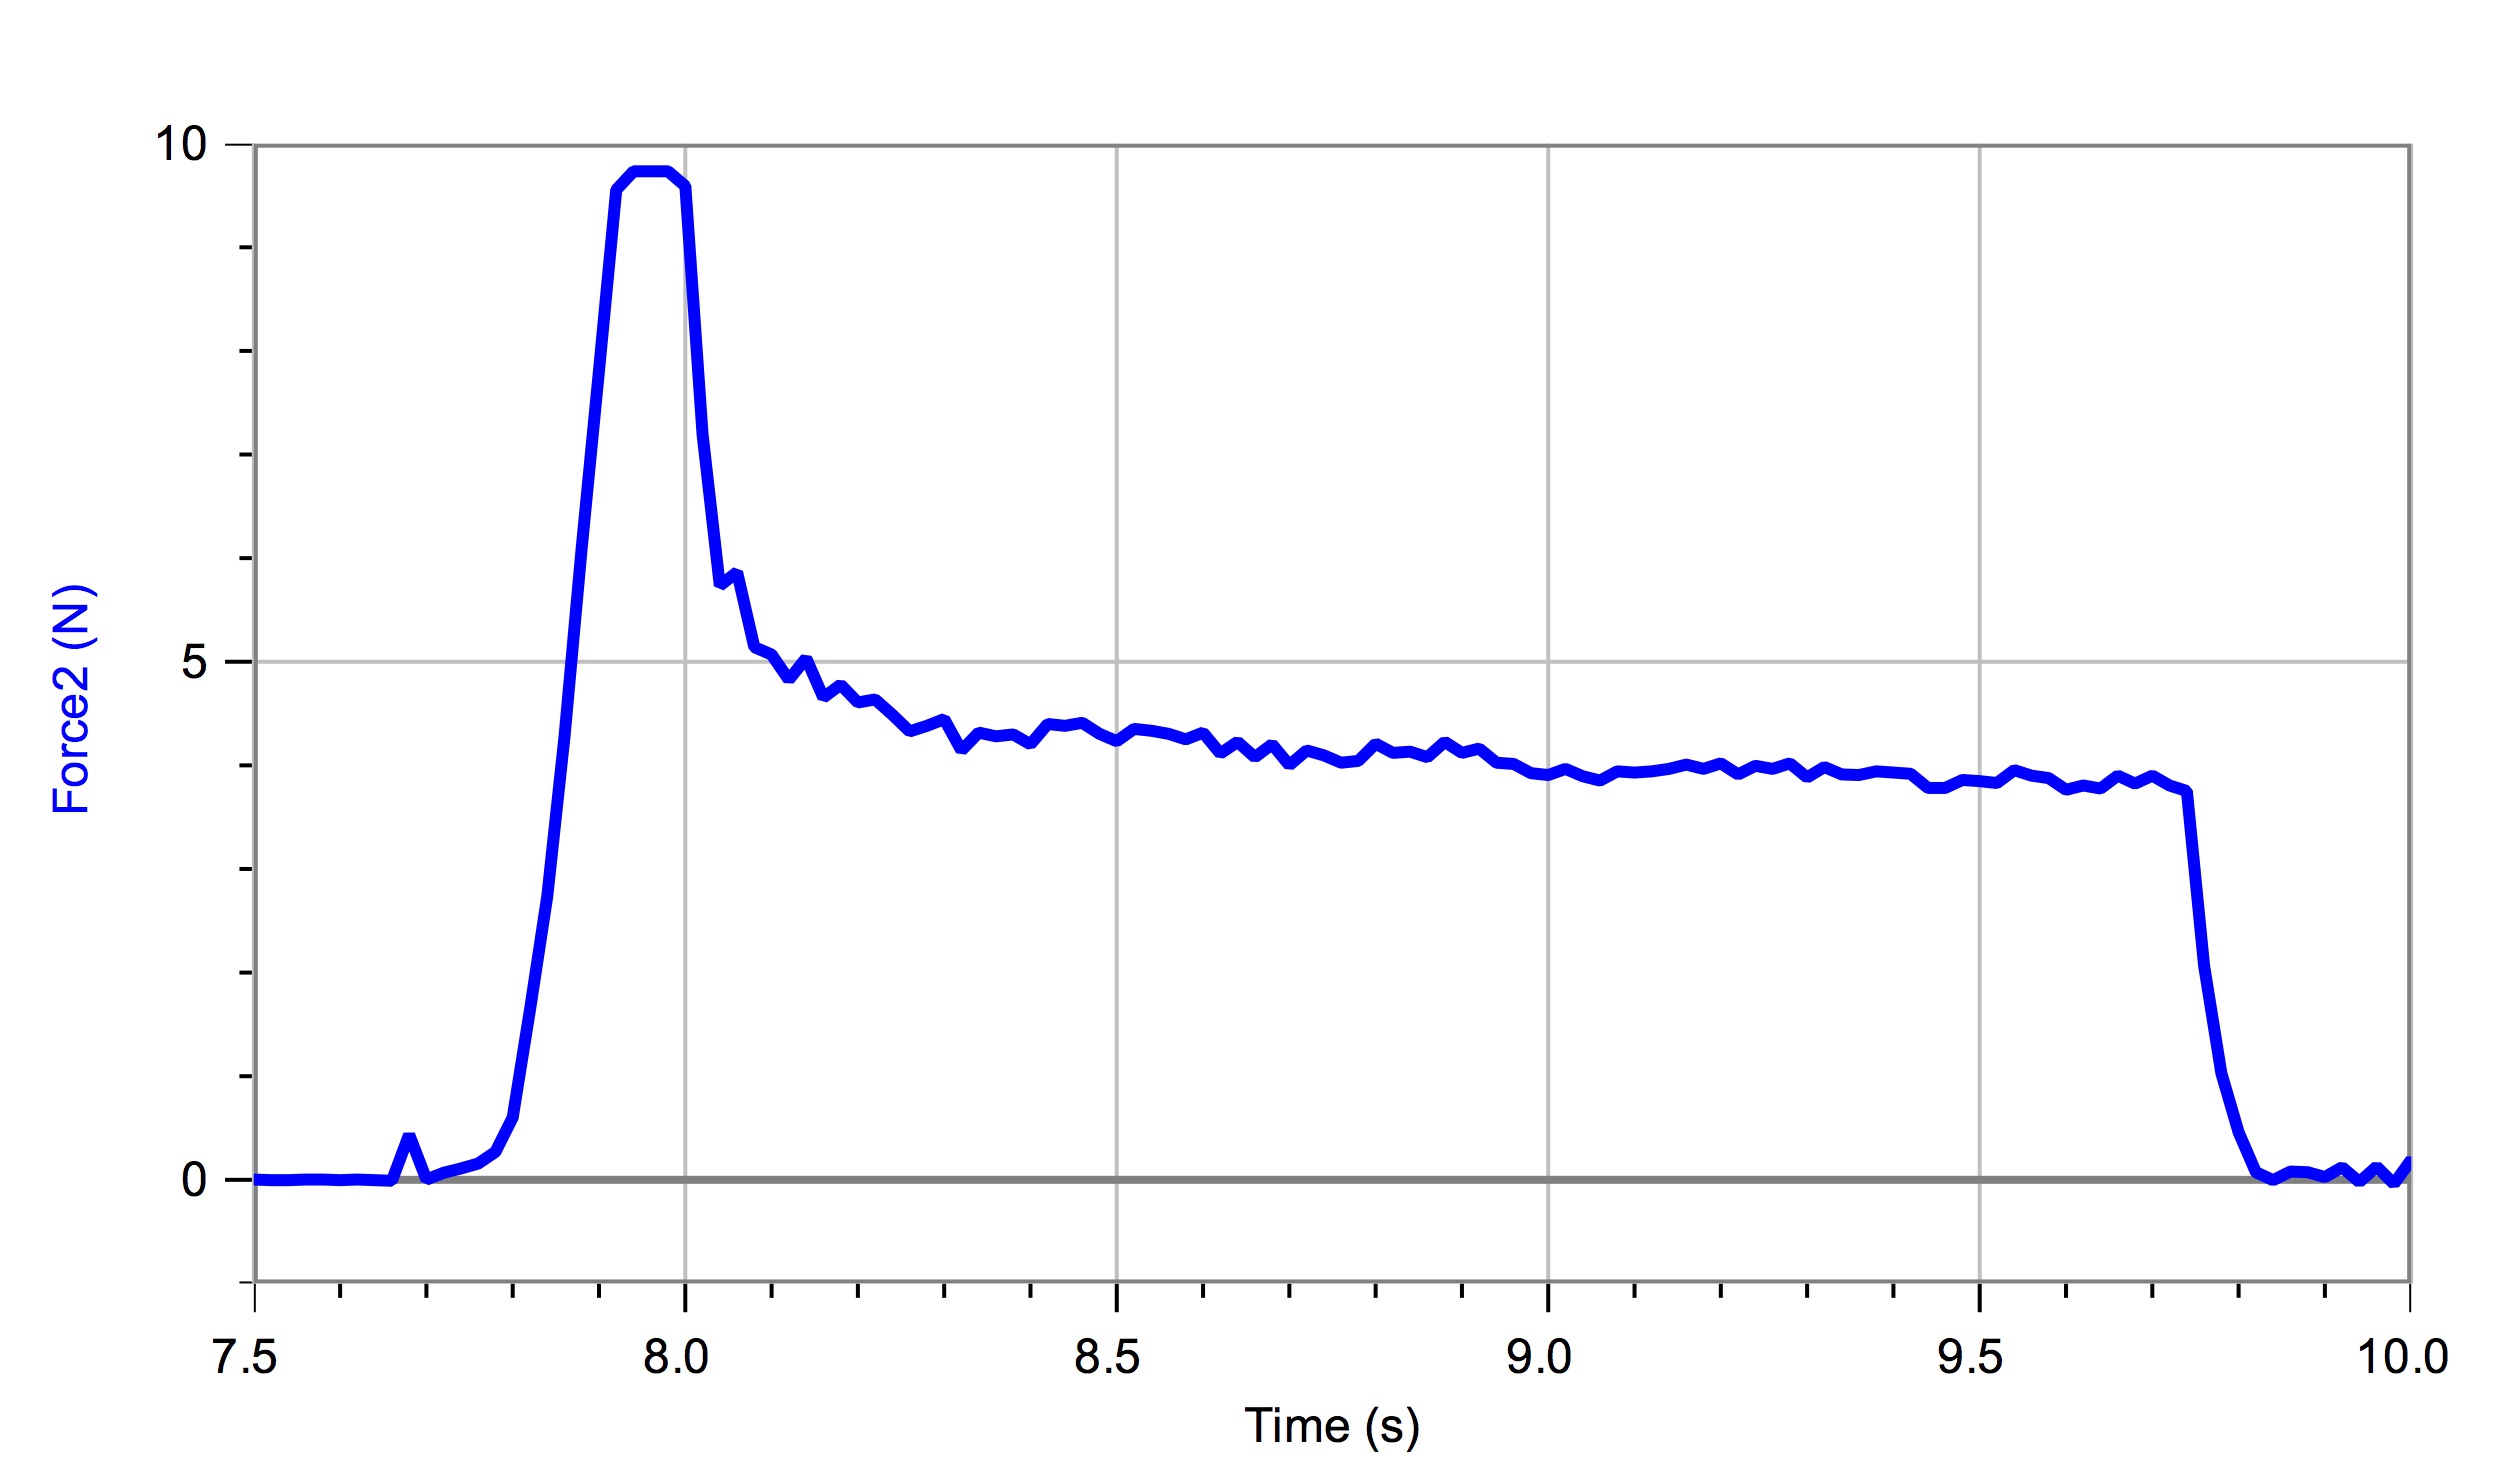
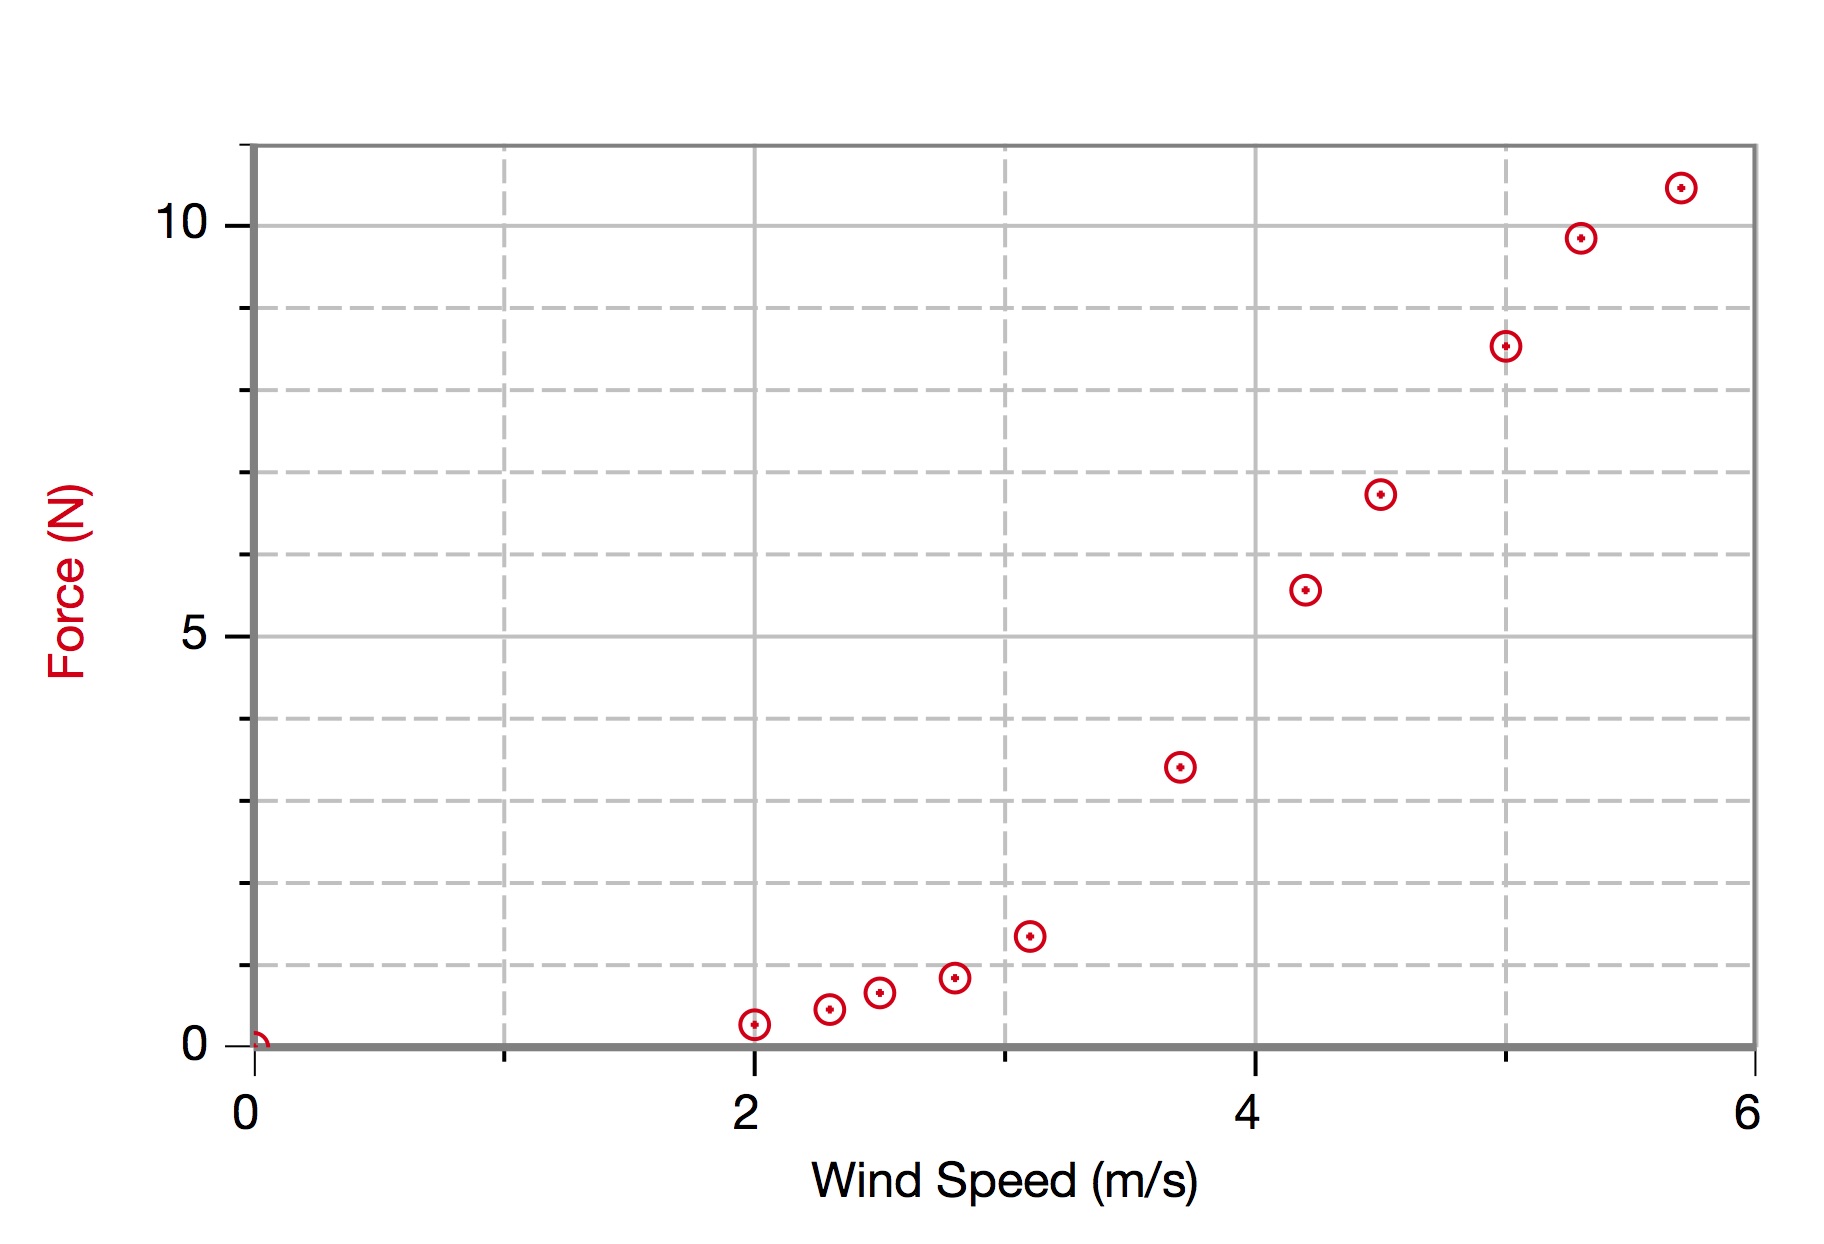
When the data is displayed in a graphing program, it looks like this:
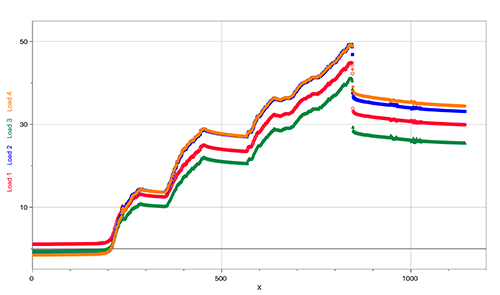
Sample bridge data

Sample bridge data

You can see that the four sensors do not read equal values, and that the bridge begins distributing the load unevenly. The blue and orange lines show that these two load sensors were equally loading and were taking on a larger load than the green and red values from the other two load sensors. Later inspection of the bridge showed that this bridge failed at the load sensors that were recording a higher load value. Also, these sensors were located diagonally from one another, and once again showed that the bridge was being twisted.

You can also see that around 80 seconds (the 800 data sample) that the bridge experienced a sudden decrease in load – this was the point of failure. The data clearly shows a point at which the bridge failed and thus gives us a clear metric for performance.

The student teams were each given the results and were asked to answer these questions:

  1. What was the maximum load that your bridge sustained before failure?
  2. Calculate the load to weight ratio of your bridge.
  3. What were the individual maximum force values on each load sensor before failure?
  4. Identify on your bridge where the bridge failed. Take a picture of this point of failure and note its location.
  5. Based on the load data for the four sensors, describe why your bridge may have failed.
  6. What could you have done to increase the performance of your bridge?

The data really allowed for some rich analysis and the students were able to make some really informed critiques of their design and fabrication quality. We have been very happy with the results!

Future Improvements

For version 2.0 we hope to add these improvements:

  • Add the ability to measure deflection. We think that this might be done by measuring the angular displacement of the loading wheel, but we aren’t sure just yet.
  • Some way for the software to detect a failure – perhaps a way to detect a significant decrease in the load data. It would have to allow for some downward movement of the load data because there is some settling and deforming that can occur that might not be catastrophic.
  • It would be nice to clean up the code – especially the Processing code. I’d like to add some fancy GUI elements too so that it is a bit more attractive.

If you would like to build your own advanced bridge tester for your classroom, we can send you all our CAD files, software files and even answer questions. Its not easy to build, but its fun, and we spent about $350 dollars on this project as opposed to the $1000 to $1300 that the vendors are selling theirs for.

A Modernized Bridge Design Contest

IMG_0283

Modernizing An Old Classic

We have just completed the second project in the Academy for the 2014-15 school year. It was a huge success! This project takes a classic physics project and “upgrades” it by incorporating modern engineering design technology and fabrication techniques.

We started with a great project that is now available online through Engineering Encounters. This was a project that was originally published by Stephen J. Ressler of the United States Military Academy. It is a rigorous approach to designing and building bridges from file folders:

https://bridgecontest.org/resources/file-folder-bridges/

Its a great project with an incredible set of resources, background information, and step by step instructions. Unlike less rigorous and involved bridge design projects (using toothpicks for example), this project has the students building compression members (beams) and tension members (cords) and gussets to better model real world designs and to give the students the opportunity to learn and make decisions about which members to use in different parts of their own designs.

The only issue that we had with this project is that it requires the rather tedious process of having students trace out the unfolded beam designs onto file folder material and then use scissors and  blades to cut out each beam and cord. But we have a laser cutter! There had to be a way to incorporate both 3D CAD design and our laser cutter in order to modernize this process. We also knew that Autodesk Inventor had some really amazing tools for analyzing design structures.

From Sheet Metal To Manila Folders

Autodesk Inventor has an amazing set of tools for designing sheet metal parts. Using these tools, an engineer can construct 3D models made of folded metal parts made from just about any thickness of metal stock. Once you have designed the folded metal part, Inventor will create a flat pattern design for you that you could then send to a CNC plasma cutter to cut from sheet metal stock. You would then fold the part up manually and you would have your folded part.

Inventor gives you the ability to custom define the thickness of your stock, and some of the parameters around how it can be bent. We defined our stock to be as thick as manila folder paper. The next step is a bit tricky, but with the help of a great video I came across from Rob Cohee, we were able to define custom folded paper beam stock that the students could then use to build out their frames. Once again, Inventor has an amazing set of tools for defining structural frames (called The Frame Generator) that can then be populated with any kind of structural beam. You can also define your own structural beams that can be used to populate your frame.

I have included a video below that we use with the students to help guide them through this process:

Using the frame generator tool in Inventor also allows the student to miter and trim the beam members, which allows the students to focus on design rather than getting lost in the time consuming process of calculating the cut angles. The following video shows you how this can be done:

Once the students had designed the bridges, it was time to prepare the flat patterns and have the laser cutter do the work of cutting them out.

Fold, Glue, Repeat. (Some Assembly Required)

IMG_0353

The students prepare their flat pattern cut-outs for the laser cutter and then you let the laser “rip”! Its awesome to sit back and watch this machine cut. I never get sick of watching it! Having the students do this would take SO much longer, the cut parts would be less accurate, and as all CTE teachers know, one of the most dangerous tools in the shop is an Exacto blade.

IMG_0355

Some might argue that the “manual” process of cutting all these beams out by hand is “good for the students”, but we feel that saving time here allows us to use that time in other areas, such as virtual testing.  Before the students get to build their design, we ask them to use Inventor’s frame analysis tools to help them analyze potential weaknesses in their designs. The following video shows just how amazing this tool is:

Once the students have done their analysis and cut their construction members, its time for folding and gluing, and folding, and gluing, and … At this point our project does not differ from the Engineering Encounters project. The students use a sheet of paper (actually two 11 x 17 sheets) with an elevation view (printed from Inventor as a CAD drawing) glued to a board as a guide for assembling the beams, cords and gussets:

IMG_0351

IMG_0362

This process goes relatively quickly as the students have done all the prep work to make sure that the pieces all fit together. Once again, this really demonstrates how modern technology can allow the students to focus their attention on design.

To Break Or Not To Break

Once the bridges are assembled, its time to test them out. The performance metrics for the contest are not actually based on the strongest bridge but rather a more realistic approach. We have attached a monetary value to each beam, gusset and cord. The bridges are then tested to a set value – the required load. The bridge that holds that load and is “manufactured” least amount of money is then given the highest marks.

Once the bridge has been tested at the required load, we then give the students the choice to see just how much the bridges can hold before catastrophic failure. Most students (encouraged by both peers and staff!) decide to take their bridge to the limit.

Its always a fun way to end the project!

Modeling A Rocket’s Journey – A Synthesis

A Synthesis Of All The Models (Thus Far)

In this post I will describe a culminating activity for the first year students in the Academy. This is really the destination that the students have been headed towards since the beginning of the course. Everything they have learned is synthesized in this activity where the students gather data from various observations/experiments and then use the data to predict their own model rocket’s journey.

Note: There were two significant simplifications that we had to make based on the ability level of the students and the physics content covered in class. We had to assume that there was no air resistance force acting on the rocket during the thrust and cruise phases. We also assumed that the mass of the rocket did not change. I intend to have the students reflect on how this might affect the predictions and then analyze the actual performance data. More on this later…

Measuring The Rocket Engine Thrust

We first needed to figure out the average force exerted by the rocket motor on the rockets and the time interval during which that force would be applied. This would give the students both the thrust force and the length of time of the thrust phase. We needed to collect force measurements for the rocket motors that we were using (C6-5). You can actually download this from many different websites, but it was much more fun to actually do it ourselves! Mr. Holt made a neat little rocket motor holder that was attached to a force meter and we went out into the rain to test the motor (see video below – thank’s Gary!):

The force data was then shared out to the students – here is what the graph looked like:

rocket-engine-test

And this is the force vs time graph one retailer posted on their website:

Although the students had not been introduced to the concept of Impulse-Momentum transfer, we can use the average force, and that seems to work out really well. Just to make sure we could do this, I used the Integral tool in LoggerPro to measure the impulse, and it came out to 8.83 N s – really close to what Estes states – 8.8 N s.

A Mini Wind Tunnel Test

The students then needed to measure the drag force on their parachutes (all cut on our new laser cutter) as a function of air speed so that they could estimate the terminal velocity of their rocket during the descent phase.  Next step was to test the parachutes. Luckily, Mr. Holt and I had helped two of our previous students create a really nice wind tunnel. We used a force meter attached to a vertical post inside the tunnel…

parachute_test

…and then we used a little Kestrel anemometer to measure the air speed…

air_speed

Students were able to increase the air speed in the tunnel by turning a rheostat that controlled the fan speed. They then measured the wind velocity and graphed that against the measured force – just like NASA!

Here is some sample data to show how the results came out – not bad!

parachute-test-data

Students now had a way to estimate the descent velocity because they could calculate the gravitational force on their rocket, using the measured mass of their rockets, and then they could use their data to find the corresponding wind speed.

Putting It All Together

As part of their final (50%), the students were asked to then take this data, measure the mass of their model rocket and construct a prediction. The prediction was to include these five elements:

  1. A set of force diagrams for the different phases – thrust, cruise, and descent. The diagrams also had to include accompanying net force equations.
  2. An acceleration vs time graph.
  3. A velocity vs time graph.
  4. A position vs time graph.
  5. Finally a calculation sheet that includes all calculations required to create the motion graphs.

The students have been asked to turn this in before the actual launch.

As we collected the data above, I never explicitly reveal how the data should be used to make these predictions, but I do give them some guiding questions that orients them. They work with their partner’s on this report, but I warn them that they will both be held responsible for understanding the process of creating the prediction report.

Testing the Predictions

Each student rocket will be equipped with a small altimeter (from Apogee Rocketry – love this thing!).

This altimeter records altitude data in 1/10 of a second intervals, and we have found it to be very accurate and reliable. We will be launching next week, so tune in soon for an exciting update on how the launches went!

Building The Net Torque Model – Part 2

Investigating An Unbalanced Net Torque

We started by looking at the fact that a disk experiencing a net unbalanced torque also experienced a change in rotational or angular velocity. The students used a rotary motion sensor to measure the angular position and the angular velocity of a disk experiencing a constant torque and the students immediately recognized the similarity between a particle experiencing constant linear acceleration and a rigid body experiencing constant angular acceleration.

IMG_0704

So, the natural next step in our investigation was to determine the causal relationship between a net unbalanced torque and the angular motion state of a rigid body. The students discussed how we might set up an investigation that would help us understand this relationship, and I helped guide them towards a final investigation design where we used a rotary motion sensor attached to the wooden disk we had used in a previous investigation.

The rotary sensors from Vernier are rather expensive, but also quite nice. They come with a plastic spindle with three different pulley radii. The only issue that I have with these is that they do not include a useful screw for attaching objects to the pulley – they expect you to purchase their completely over priced accessory kit. I don’t suggest this. Instead, you can create your own and then use a 6/32 screw to attach them to the pulley – just be careful not strip the threads!

IMG_0703

Working off a similar investigation when studying the causal relationship between a net unbalanced force and linear acceleration, the students recognized that we needed to include a force sensor for measuring the applied force. The students then had LoggerPro plot the points for the calculated torque (using a calculated column) and the measured angular acceleration.  The data isn’t super clean, but its good enough for the students to conclude that the relationship is most likely linear.

Dimensional Analysis – Inferring Rotational Inertia

I was amazed to discover that some students in the class set off to understand what the units of the slope could be reduced to. They immediately saw that the proportional constant (slope) included kg (mass) but that wasn’t all. After some work, the class had determined that the units for the slope were kg * m^2.

This led to a qualitative discussion about the inertia of rotating objects. We discussed hoops and disks primarily, and the class seemed to agree that the units made sense. Although I didn’t have any hoop-disk sets like the ones you can buy from various vendors, we did perform some thought experiments around mass distribution and rotation, but we needed to be sure that we were on the right track.

A Better Variable Inertia Disk

So last year I was looking for an investigation that would really help the students discover the importance of mass distribution for a rotating object. Reading the material on the AMTA website regarding the unit on rotational motion, the researches stressed the importance of connecting mass distribution to the rotational inertia. I found this variable inertia disk from Fischer Scientific and decided to purchase it. I commend these guys on making this, but frankly I decided that I could make a better one.

My colleague and I set about redesigning these disks. The improvements we made included a) better compartments for the metal marbles so that they didn’t move around, b) an index and lip so that the two sides fit more securely together, and c) more compartments so that we can test more mass configurations. After we made our designs, we used our Makerbot 3D printer to print out ten copies of the disks.

IMG_0707 IMG_0708

With these disks attached to the rotary motion sensors, the students were able to confirm that although the total mass of the disk did not change, the angular acceleration declined as the mass was moved outward from the radius of rotation. This was more of a qualitative investigation, but I think the students were able to clearly see how moving the mass farther from the axis affected the rotational inertia of the disk.

Deploying The Model (So far)

Now that the students had built a predictive model that described the quantitative relationship between rotational inertia, angular acceleration and net torque, they were ready to test it.

We returned to the investigation setup with the disk, but this time attached a hanging mass to the string and they attempted to predict the angular acceleration. The students immediately made the mistake (as I thought they might) in considering only the disk in the system. This gave me a chance to review with them the following process:

  1. Identify the system schema (now it includes things that can rotate!)
  2. Draw your force vector (free body/particle) diagrams and now also your force-moment arm (rigid body) diagrams.
  3. Write the summation of forces AND the summation of torques for the system.
  4. Do some algebra.

The trickiest part to figuring this out is getting the signs right due to interaction pairs and making sure that they agree. I ask the students to start with a diagram and then go through and label each force + or – by picking a force and then finding its partner and then making sure that the rest of the force directions agree.

Once they were able to get a prediction that we all agreed seemed correct, they ran the experiment. The class was able to predict the angular acceleration within about 10% error. We discussed the possible reason for discrepancy which led to some interesting discussions around modeling the rotational inertia of the attachment screw and washer, and also the frictional forces at work.

The students were pretty convinced that the model worked, and so next stop – energy and momentum in systems with rotational motion.

Our New Full Spectrum Laser

Last week our new Full Spectrum Laser arrived at school. Thanks to the generous donation of a graduating senior’s parents, we were able to purchase the Full Spectrum Pro LF Series 36×24 model with a 90 W laser upgrade and active water chiller. This cutter replaces our eight year old laser that has had some serious problems rendering it essentially useless last year, which really affected one of our major projects.

This new laser arrived in a large wooden box that was a bit intimidating as we knew that we had to figure out how to get the laser out of the box and then into the room next door. We had to cut a hole in the adjoining wall, which actually wasn’t that difficult, but we will need to go back and fill that in!

We are really excited about the new device and look forward to using it on the first project of the year.

photo 1 photo 2 photo 3