A Synthesis Of All The Models (Thus Far)
In this post I will describe a culminating activity for the first year students in the Academy. This is really the destination that the students have been headed towards since the beginning of the course. Everything they have learned is synthesized in this activity where the students gather data from various observations/experiments and then use the data to predict their own model rocket’s journey.
Note: There were two significant simplifications that we had to make based on the ability level of the students and the physics content covered in class. We had to assume that there was no air resistance force acting on the rocket during the thrust and cruise phases. We also assumed that the mass of the rocket did not change. I intend to have the students reflect on how this might affect the predictions and then analyze the actual performance data. More on this later…
Measuring The Rocket Engine Thrust
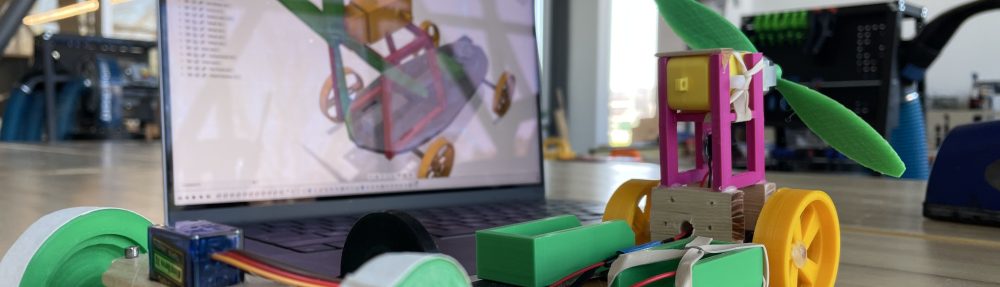
We first needed to figure out the average force exerted by the rocket motor on the rockets and the time interval during which that force would be applied. This would give the students both the thrust force and the length of time of the thrust phase. We needed to collect force measurements for the rocket motors that we were using (C6-5). You can actually download this from many different websites, but it was much more fun to actually do it ourselves! Mr. Holt made a neat little rocket motor holder that was attached to a force meter and we went out into the rain to test the motor (see video below – thank’s Gary!):
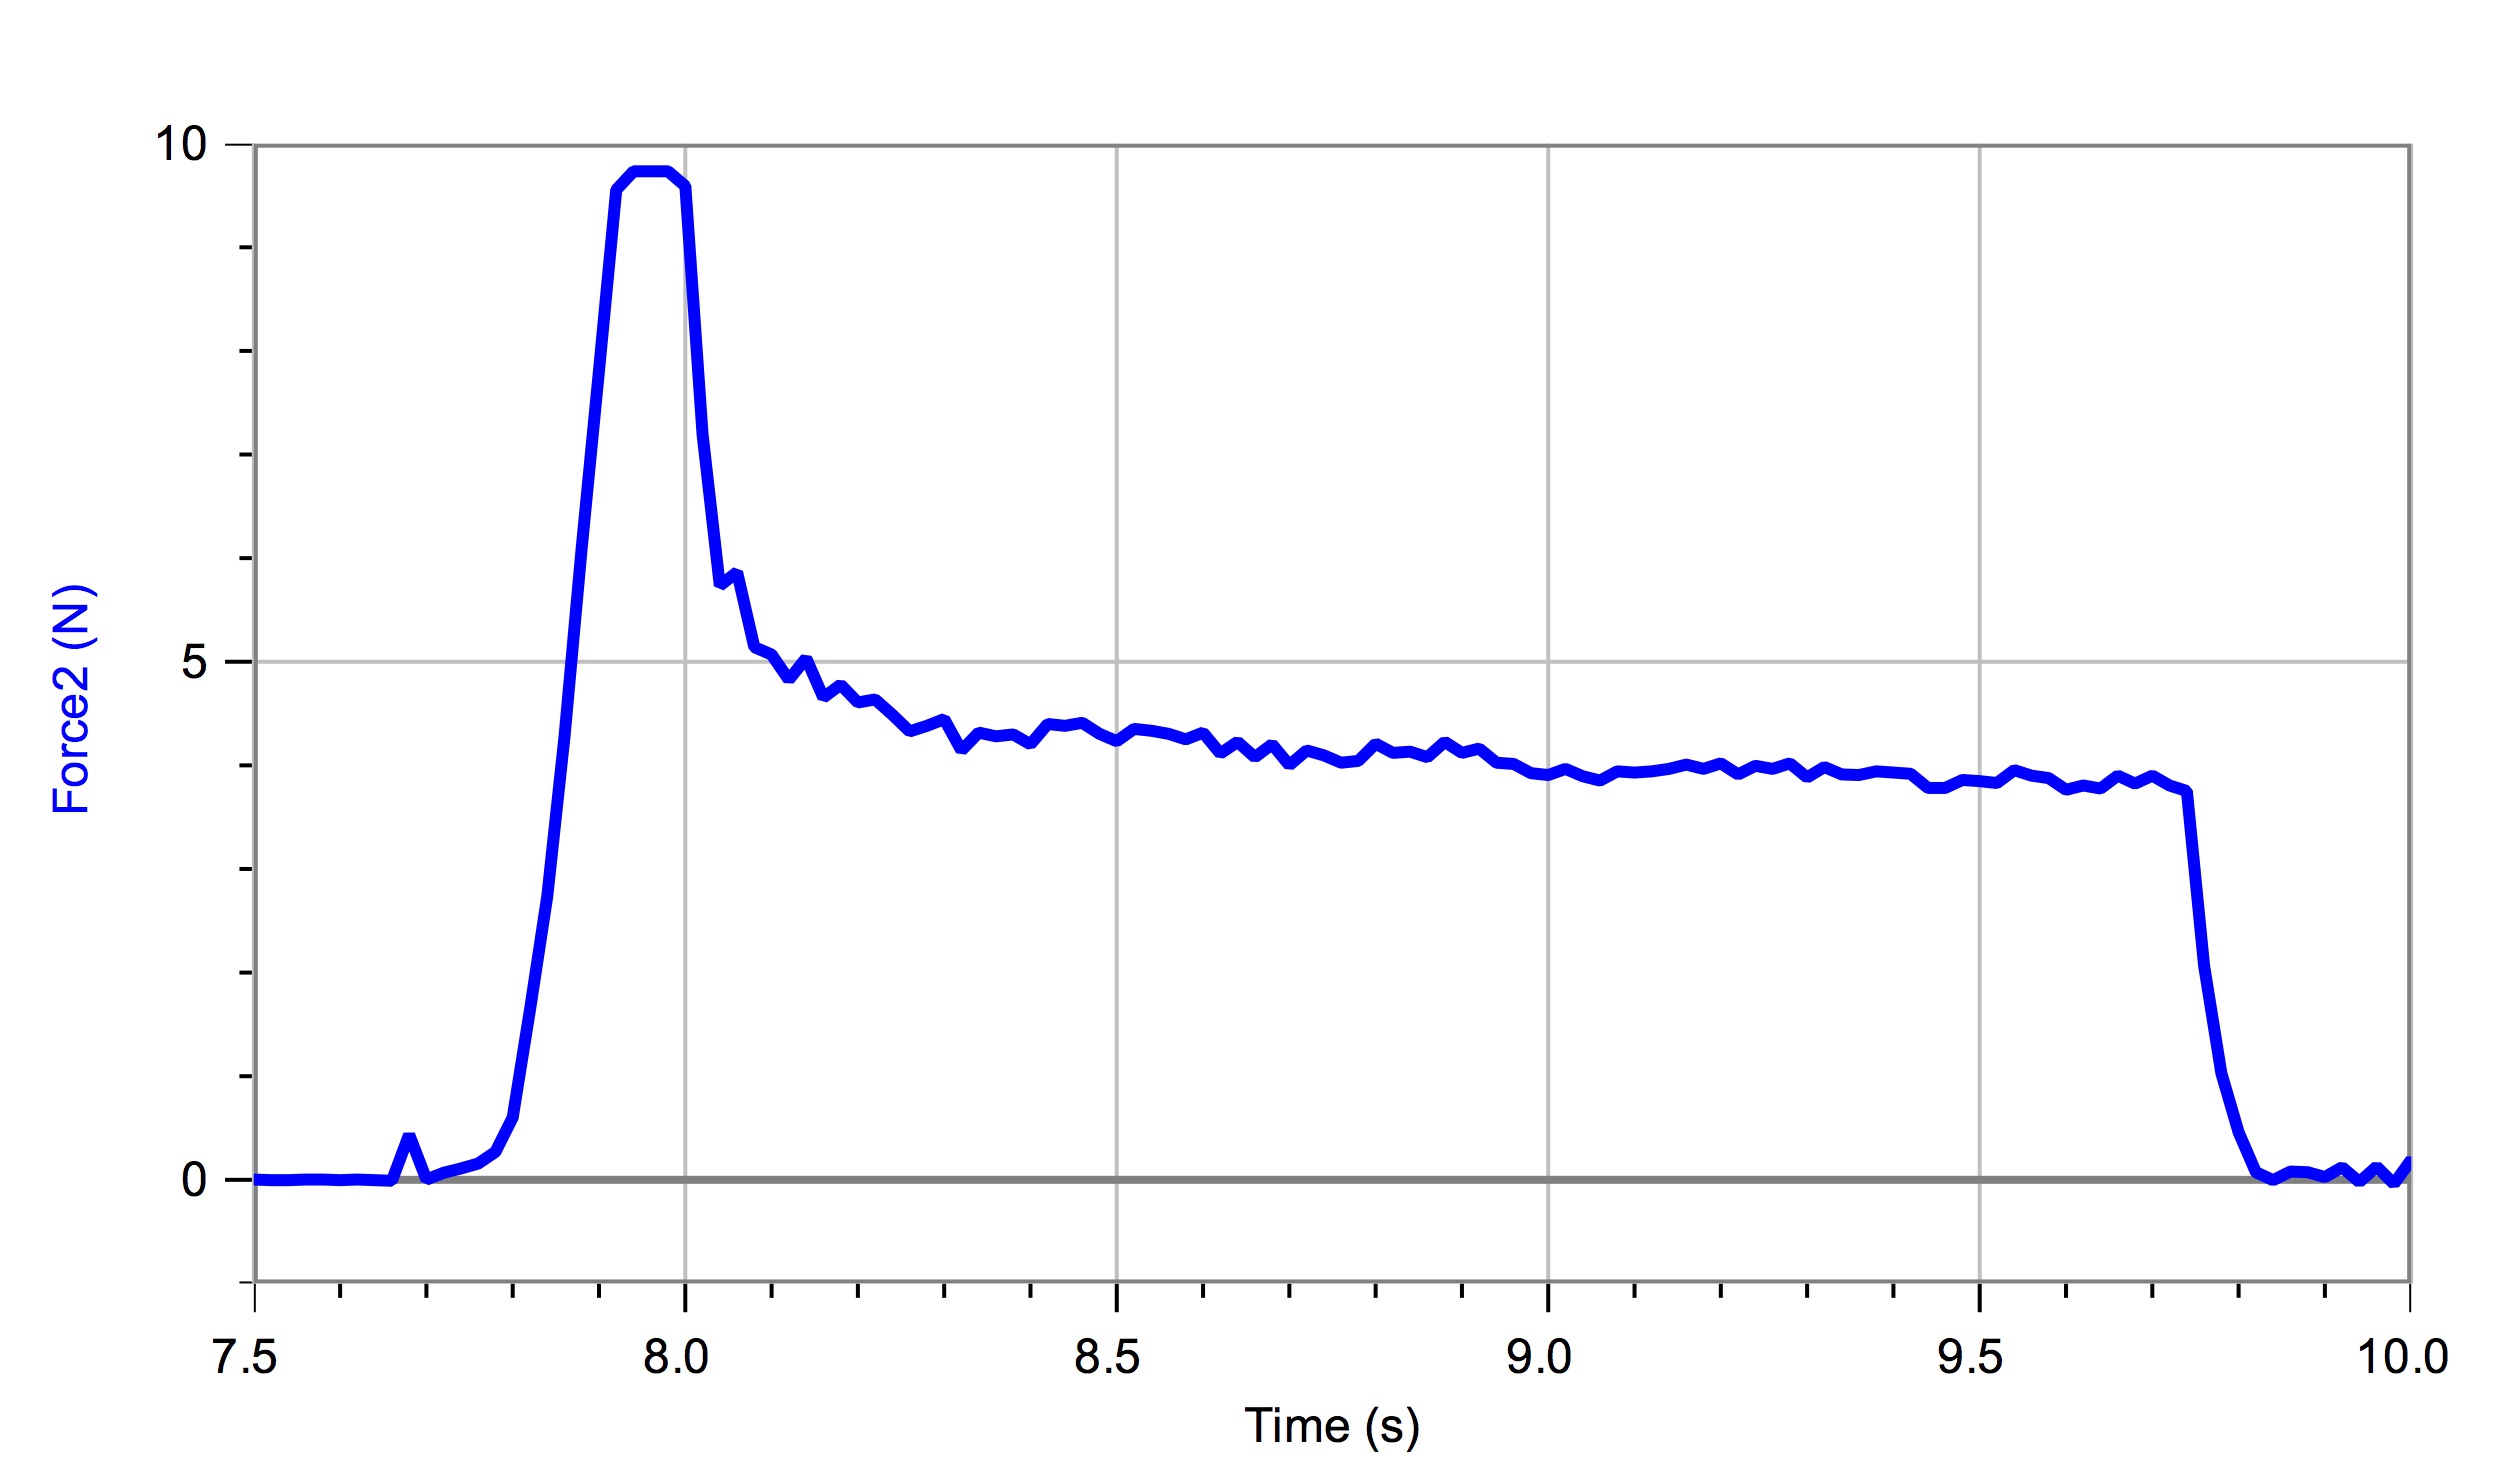
The force data was then shared out to the students – here is what the graph looked like:
And this is the force vs time graph one retailer posted on their website:

Although the students had not been introduced to the concept of Impulse-Momentum transfer, we can use the average force, and that seems to work out really well. Just to make sure we could do this, I used the Integral tool in LoggerPro to measure the impulse, and it came out to 8.83 N s – really close to what Estes states – 8.8 N s.
A Mini Wind Tunnel Test
The students then needed to measure the drag force on their parachutes (all cut on our new laser cutter) as a function of air speed so that they could estimate the terminal velocity of their rocket during the descent phase. Next step was to test the parachutes. Luckily, Mr. Holt and I had helped two of our previous students create a really nice wind tunnel. We used a force meter attached to a vertical post inside the tunnel…

…and then we used a little Kestrel anemometer to measure the air speed…

Students were able to increase the air speed in the tunnel by turning a rheostat that controlled the fan speed. They then measured the wind velocity and graphed that against the measured force – just like NASA!
Here is some sample data to show how the results came out – not bad!
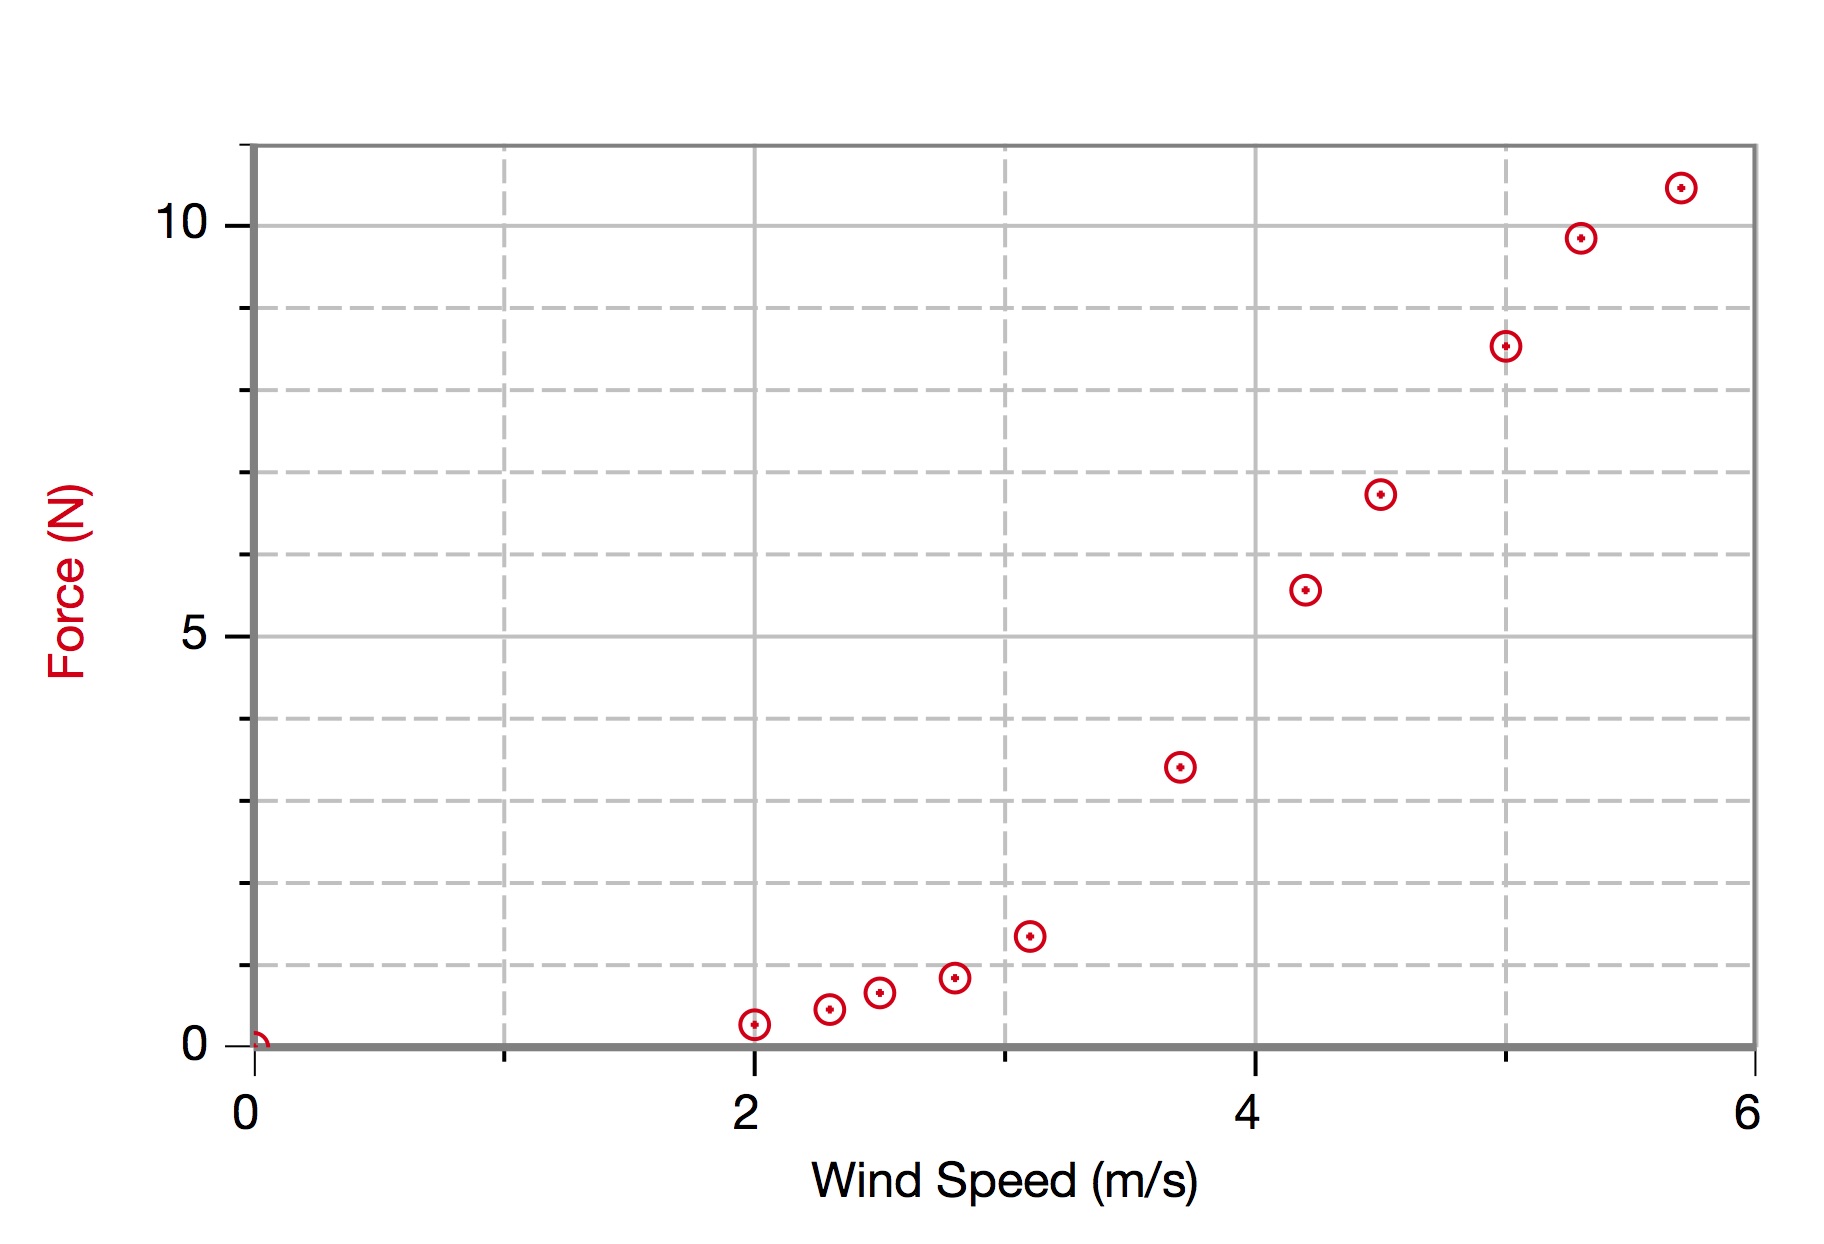
Students now had a way to estimate the descent velocity because they could calculate the gravitational force on their rocket, using the measured mass of their rockets, and then they could use their data to find the corresponding wind speed.
Putting It All Together
As part of their final (50%), the students were asked to then take this data, measure the mass of their model rocket and construct a prediction. The prediction was to include these five elements:
- A set of force diagrams for the different phases – thrust, cruise, and descent. The diagrams also had to include accompanying net force equations.
- An acceleration vs time graph.
- A velocity vs time graph.
- A position vs time graph.
- Finally a calculation sheet that includes all calculations required to create the motion graphs.
The students have been asked to turn this in before the actual launch.
As we collected the data above, I never explicitly reveal how the data should be used to make these predictions, but I do give them some guiding questions that orients them. They work with their partner’s on this report, but I warn them that they will both be held responsible for understanding the process of creating the prediction report.
Testing the Predictions
Each student rocket will be equipped with a small altimeter (from Apogee Rocketry – love this thing!).

This altimeter records altitude data in 1/10 of a second intervals, and we have found it to be very accurate and reliable. We will be launching next week, so tune in soon for an exciting update on how the launches went!

AWESOME!!!!! so t his is what my daughter has been so exited about all semester. Wonderful. Looking forward to witnessing the launch. When is it?
Maxine Epstein
parent of Adina Epstein
LikeLike
I’m really sorry if you missed the launch Maxine! Due to some pretty bad weather we had to reschedule twice. I think when we finally launched, it was a decision made very quickly due to the time constraint at the end of the semester. I do have some photos and videos and I plan to share those to the parents soon!
LikeLike
Pingback: We Have Lift Off! | Academy of Physics and Technology
Pingback: Analyzing A Rocket’s Performance – A Common Core Assessment | Academy of Physics and Technology
Pingback: Computational Deployment: Simulating A Rocket | Academy of Physics and Technology