Computational Deployment: Simulating A Rocket

The model rocket project has long been a favorite at the Academy. For the past fifteen years, students have designed, fabricated and then launched model rockets as the first project of the program. Over the years, I have tweaked the project several times, each time finding new ways to introduce authentic analysis in the process.

This year I have taken a deep dive into computational modeling, and as part of the rocket project, students were asked to create a simulation of their rocket prior to launch. In this post I will discuss how I did this, and how it turned out.

Simulating The Momentum Principle:

Prior to getting started on this, students investigated the causal relationship between forces and changes in motion. Using force sensors, carts, weights and elastic cords of different lengths, students began building a qualitative and quantitative model relating the momentum of a particle to the forces acting on the particle.

Screen Shot 2018-12-22 at 9.27.05 AM

In previous years, I waited to introduce momentum until after a significant amount of time was spent on forces, balanced and unbalanced. This year I decided to go directly to momentum. This is a bit of a break from the established modeling instruction sequence, but I think its a good alternative that is also suggested by the great textbook Matter and Interactions. The momentum principle can easily be modeled computationally and I think the students are able to grasp it conceptually.

I have included a link to a Google Doc that is the introductory activity that I created. My approach here, as it has been with this entire unit is to give the students guided questions that allow the students to discover and investigate the code required to simulate the momentum principle. This is my first attempt, and I am sure it will undergo many revisions:

Simulating The Momentum Principle

Introducing Conditional Behavior

One of the really great things about building a simulation of a rocket has three distinct phases of its trajectory – the thrust phase, the cruise phase and the descent phase. This gives the students three different phenomena to study and simulate: positive acceleration when two unbalanced forces are acting on the rocket during the thrust phase, free fall when the fuel runs out, and then constant velocity when the parachute has been deployed.

In order to simulate this, students needed a way to change the forces acting on the rocket at different time intervals. This is done using a conditional statement:

If This Then That

Conditional statements are very easy to create in Tychos – but they work a bit differently from other programming interfaces. Here is an example:

# The thrust force - F (thrust, rocket, fuel)
Ftrf = if (t < 1.8, [0, 6], [0, 0])

In this code snippet, a force is given a different value based on a condition, in this case whether the time in the simulation is less than 1.8 seconds. If it is, then the force is given a positive 6 value in the Y direction, and if the time is greater than 1.8 seconds, then the force becomes zero.

This allows the students to simulate the thrust phase of the rocket by having the thrust force disappear once the fuel has run out. We conducted tests on Estes C6-5 rocket engines in order to establish the time value. You can read more about how we did this here.

The students did the same thing to figure out when the parachute should deploy. Again this was established based on information from Estes as well as our own tests.

Comparing Simulation Data to Real Data

The students could analyze the simulated rocket behavior by using the graphing tools in Tychos. The students graphed the vertical velocity as well as the vertical position of their simulated rockets. Here is an example of what those graphs look like:

Screen Shot 2018-12-22 at 10.22.21 AM

The last step of the process was for the students to compare their simulated data to the real data that was captured by the altimeter that we use in the rocket’s payload. Below are two images of the graphs of the data they retrieved from the rocket’s altimeter:

rocket_v_graph

velocity data from altimeter – imported into LoggerPro

rocket_y_graph

altitude data from altimeter – imported into LoggerPro

The shapes of the graphs from the simulated data and the real data are very similar! That was certainly exciting to see that the simulations were at least giving results that qualitatively matched the real behavior of the rockets.

Two factors that certainly created significant discrepancies between the real rockets and the simulated rockets was the existence of air resistance on the real rocket, and the fact that the real rockets didn’t always go perfectly straight up! We plan on modifying the simulations, but that will have to wait for a future post.

Recruiting the Girls.

18485799_1373393066108921_6346993731891607211_n

This post was written by Johnie Lee Fain, a recent graduate of San Rafael High School and the Academy. She is currently planning on studying computer science at Villanova University


I spent three years of my high school career in the engineering lab, and at most, there were six other girls beside me.

As a high school senior presented with the challenge of choosing an engineering project to research and produce as the focus of my third year in the Academy I turned to my own experience. I wanted more female students to discover an appreciation for not just STEM studies, but applying it to their own interests, whether that be art, fashion, literature, etc. Based on my opportunity to work with physics, fabrication and design, and computer science, my goal was to reach out to other girls, and facilitate a community of exposure and collaborative thinking for female students on campus and their varying degrees of interests in a STEM education. I then took this inspiration and used programming as my platform.

The graph below shows the enrollment ratio of male to female students From the 2013-14 academic year to 2016-17. 

graph

After initial research of the outstanding gender gap in science based fields, I focused my project development on the San Rafael High School campus specifically. Aside from my own opinions, I sought to learn and understand the experiences of my female peers in STEM as well as those who showed little enthusiasm about the subject. Thus, a discussion group was created to pair girls with little to no experience in STEM, with another eagerly involved student. This transition sought to introduce topics of discussion, and create a space for learning, project development and sharing of peer to peer experiences. Through this I sought to introduce Science, Technology, Math and engineering as an opportunity rather than an unknown.


girls_screening

SRHS Girls at the screening of CODE: Debugging the Gender Gap

There was a larger emphasis on social participation in my project than I had expected initially. I found myself talking to administrators, talking to younger students, and researching new ways to encourage young females than focusing on the technical aspects of my project. It is safe to say I underestimated my ability to create a recruiting website from scratch when I was still learning the basics of Computer Science. This deficit in what I thought was my only was to reach out to the community was in fact an example of the very work I was trying to emphasize. That while learning something new, I could share my thoughts, work and progress withe the girls around me.


Outside of San Rafael, I found mentorships and employment opportunities to help guide my project. Under the guidance of Ryan Robinett, a former partner at the software company Digital Foundry, I was able to visualize what I was attempting to accomplish in website design in the “real world.” This exposure not only broadened my understanding of the complexity of computing but as well as its team based nature. I felt somewhat vindicated in my struggle to produce something original when on a day to day basis software engineers are working in groups almost entirely. Additionally, my employment as a coding instructor at Mill Valley Code Club, a program designed to teach elementary through middle school students how to computer program, I was practicing how to explain and teach the vary programming fundamentals I was learning to a younger audience. Certainly solidifying the material I knew, and highlighting what I had yet to understand.


Ending the year I found I had not only exposed myself to programming in a variety of ways but had introduced the importance of collaborative thinking and communication amongst the female students and their envelopment in STEM education. Moving forward, the importance is consistency. Through deliberate action and communication, the next batch of San Rafael High School Engineering Academy graduates have an opportunity to continue to close the gender gap and inspire others.

girls_screening2

SRHS girls meeting the film maker of She Started It

The Great (Mini) Robot Race

Robotics – The Synthesis Project

The final project of the two year academy program requires that the students design, fabricate, program and test an autonomous robot. We have been doing this project since the inception of the program, but this year we have made some significant improvements on the project. In this post I will explain the project, and highlight those improvements.

This project is an extremely challenging task that requires successfully completing several “sub-projects”. We tell the students at the beginning of the school year, that this project is more difficult than any of the other projects – by a long shot!

“If you haven’t done everything, then you haven’t done a thing.” – Red Whittaker

We completely changed our robot competition parameters this year. In previous years we had the students design sumo wrestling battle bots. Although this was a fun project, we started to notice that some robots performed really well without really having to “think”. These robots generally lumbered around the ring, sometimes without even actually “seeing” their opponents. Through pure luck they just managed to push their lighter opponents out of the ring. We decided that we needed to change the project in order to force teams to be smarter and we also wanted to get away from a robot competition that seemed to focus on aggressive battle.

Ironically, I suppose, our robot project changes were inspired by the classic Nova film that documented the DARPA challenge known as the Great Robot Race. In this race, the autonomous vehicles raced through the Mohave dessert on a course that was revealed to the competitors only hours before the beginning of the race.

Bob set about building an impressive “maze” for the robots to navigate. The robots had to make their way through a series of 90 degree turns defined by a series of connecting corridors with vertical walls about 20 cm tall. The robots were then given two attempts to make it through the course as fast as they could.

The Brains and Braun

When we first started this project about twelve years ago, we first used a Java based board that we liked, but it was really expensive and we didn’t really need much of the hardware and software features that it offered. About eight years ago, the Arduino board was taking the Maker community by storm and we decided to hop on the Arduino bandwagon, and we have been very happy ever since. The simplicity, online community, the plethora of code examples and tutorials as well as the price have been key points in why we have decided to keep using the Arduino. This year we decided to incorporate DC motors from Sparkfun and Adafruit’s motor shield. The combination allowed the students more flexibility regarding drive train design, and also allowed for some interesting discussions around the advantages and disadvantages of servos vs dc motors. Our only complaint with the shield would be that it would be nice to have the headers pre soldered!

Designing The Circuitry

fritzing-preview-pcb

One of the major additions to the project was to require that students design and fabricate the circuitry for their robots. We did this by introducing two new skills to the project. Students had to learn how to use a printed circuit board (PCB) design software known as Fritzing, and then they had to learn how to fabricate their PCB boards using a CNC mill.

There are a number of amazing PCB design tools out there – and many are free! They all have their strengths and weaknesses. Here is what we found out as we did our research to find the right tool.

Autodesk’s Circuits is great because its web based, super easy to use and has an amazing feature where you can actually simulate the circuit. You can add a virtual voltmeter of ammeter to your virtual circuit and then with a push of a button, you can get virtual readings on the meters. I found this tool to be amazing for teaching circuitry and I allowed the students to use it as a “key” for their worksheets. It also has the ability to simulate an Arduino too! You can add an Arduino to your project, connect up LED’s, servos, etc. and actually see them light up or rotate as you change the code. It is a bit limited in that it doesn’t support most added libraries, but it is still amazing. We eventually decided not to use it for PCB design because it is unfortunately a bit clunky and doesn’t allow for much customization of the board.

Eagle is of course one of the most advanced and feature rich PCB design tools out there. It is also very complicated. IT of course offers the largest toolset, complete control of the design process and the free version is as close to a professional tool as one could hope for. The problem is that all these features come at a price – complexity. If we had an entire year to spend on this project, I might have decided to go with this tool, but we needed something that the students could learn quickly and weren’t going to get frustrated with…

Fritzing is a free, open source “beta” software that is very similar in look and feel to Autodesk’s Circuits – in fact I think Autodesk’s product must have been inspired by Fritzing? Although Fritzing lacks the amazing simulation tools that Autodesk Circuits has, it does offer a much better PCB design environment. The options that are available for editing the component foot prints, the PCB attributes, etc. make it really nice to work without making the tool too complex. This is the tool we decided to teach and use in class, and the students liked it.

pcb-milling-opener

Fabricating The Circuitry

Back in the fall we decided to invest in a small CNC mill produced by a local company out of San Francisco named Other Machine Co. This machine, called the OtherMill has been an amazing addition to the lab. With this machine, we have been able to teach the students how to fabricate their own PCB’s. The OtherMill is not just for PCB fabrication, in fact we have used it to mill small aluminum parts as well.

2323-00

This micro CNC desktop mill is super easy to setup, really easy to use and plays really nicely with Fusion 360 – our 3D CAD and CAM software. I was incredibly surprised and pleased by how easy it is to learn the operating software – known as OtherPlan. The company has a great support website full of great tutorials, and we were able to teach all the students how to use the machine in just a few days.

The PCB files generated by Fritzing (we exported them as Gerber files) worked flawlessly with the OtherMill, and within a very short period of time, all the students had designed and fabricated single sided PCB boards for their robots.

img_3283

The Final Results

As with any major changes to a project, there are lessons to be learned. We realized that the task was rather complicated and many of the students did not make it as far through the course as they had hoped. It was clear however that this competition proved more interesting from the perspective of getting students to see the importance of software design. Not only did we see very different software strategies, but the variance in hardware design was surprising. They really had to think about how the hardware and software had to work together, and they had to think about optimization. This was a clear advantage of this competition over the previous year’s competitions. Students spent far more time trying to figure out how they were going to shave time off their attempts, and how they were going to adjust software and hardware to better navigate the course. From our perspective, the changes to the project proved to be fantastic, and we are looking forward to improving on the project design for this year. Some of the things that we are going to do this year is introduce some different sensors for the students (like “feelers”) and also give them a price list and budget so that they have more hardware choices.

Our Custom Designed Bridge Tester

Our Goal – Make A Better Bridge Crusher!

This year Bob and I decided to upgrade our bridge project. We wanted to create an improved device for measuring the load on the model bridges created by the students. Specifically, we wanted to design a way for the students to collect meaningful performance data.

The problem with our old method (filling a bucket with sand until the bridge catastrophically failed) was that it didn’t allow for the students to collect evidence about where and why the bridge failed. In many cases, the bridge actually experienced a significant failure, but because the bridge collapsed around the loading plate, the loading plate actually acted as a support for the bridge.

We had seen other “bridge testers” from vendors (http://www.pitsco.com/Structures_Testing_Instrumenthttp://kelvin.com/kelvin-bridge-material-tester-w-cpad/http://www.vernier.com/products/sensors/vsmt/) but we had the idea that perhaps we could create one that might be better, or at least it might be fun to try. In this post, we are going to share with you what we created and why we think it actually turned out really well, but we also point out some room for improvement.

The Frame

The frame of the entire device is really based on the Vernier Structures and Materials Tester. We thought this frame was probably the best, and we wanted to make our tester from extruded aluminum tubing as well. We went about designing the bridge tester in our favorite CAD program, Fusion360 by Autodesk. We sent our CAD file to the company 8020 and they precut all our t-slotted aluminum frame members to size. This was awesome because it made assembly super easy and it saved us on shipping too! Our experience with this company was amazing – they were super helpful and even gave us some really helpful advice. If you are thinking about making anything requiring t-slotted aluminum, definitely order from them.

The Load Sensors

We wanted a a bridge tester that actually gave us data that allowed us to figure out how and why the student bridges failed. That meant that we needed more data and we needed data that could be connected to the design and fabrication of the bridge. We noticed that all the vendors’ designs had only one load sensor, and some also had a way to detect overall deflection. We suspected that we could get better data if we had four independent load sensors – one for each abutment where the bridges were supported. The four sensors would (theoretically) give the students a way to analyze how the load was being distributed, and thus tell us something about the torsional behavior of the bridge.

Sparkfun load sensor

Sparkfun load sensor

I set out to learn a bit about load sensors and I came across a fantastic tutorial at Sparkfun (https://learn.sparkfun.com/tutorials/getting-started-with-load-cells). We ordered four load sensors (see picture above) from Sparkfun. Our design (shown below) has the four load sensors  fitted with 3D printed “shoes” as the bridge abutments.

IMG_3048

The four load cells.

IMG_3044

Two load cells with abutments.

The sensors are mounted on custom fabricated aluminum plates that can be moved laterally to accommodate slightly different bridge widths. The load sensors had to be connected to load amplifiers that were then connected to an Arduino (more on that below). The load sensors were mounted to the frame of the bridge tester on custom laser cut plates:

IMG_3043

Load cell amplifiers for two load cells.

The load amplifiers have to be used with the load sensors in order to amplify the signal so that the Arduino can read the data correctly.

The Loading Mechanism

Bob designed and fabricated the loading mechanism that was based on many of the designs we had seen online. It consists of a block that is free to move vertically up or down a threaded rod which is then connected to a spoked wheel.

IMG_3047

Loading wheel.

When the wheel is turned, the block moves up or down the threaded rod. This bar is connected to a loading plate via a metal cable that hooks into the loading plate and the block:

IMG_3053

Load plate from below – revealing loading wire attachment.

IMG_3052

Loading wire attached to threaded block.

The loading plate is placed on the loading plane of the bridge (the “roadway”), and then the bridge is loaded by spinning the wheel, which lowers the block, which pulls the bridge downwards:

IMG_3050

Loading plate on bridge.

Collecting The Data: The Software

 The software responsible for collecting the data is made up of two programs – one that runs on the Arduino micro-controller that is connected to the load sensors, and the other is a Processing sketch that runs on a computer/laptop connected to the Arduino via USB. The code is pretty simple, and it was mostly written using code from other sources and then modified for our specific purposes.

The Arduino code just collects the data from the four load sensors and then sends the data serially as a comma delimited package. The Processing code reads the serial port and then essentially dumps the data into a csv file. It does have some flourishes like a graphical display of the individual sensor loads as well as a display of the total load and whether or not the bridge has met the minimum load requirement set in the project descriptor.

You can view and download all the code here on GitHub.

The Performance Report

When the data is displayed in a graphing program, it looks like this:

Sample bridge data

Sample bridge data

You can see that the four sensors do not read equal values, and that the bridge begins distributing the load unevenly. The blue and orange lines show that these two load sensors were equally loading and were taking on a larger load than the green and red values from the other two load sensors. Later inspection of the bridge showed that this bridge failed at the load sensors that were recording a higher load value. Also, these sensors were located diagonally from one another, and once again showed that the bridge was being twisted.

You can also see that around 80 seconds (the 800 data sample) that the bridge experienced a sudden decrease in load – this was the point of failure. The data clearly shows a point at which the bridge failed and thus gives us a clear metric for performance.

The student teams were each given the results and were asked to answer these questions:

  1. What was the maximum load that your bridge sustained before failure?
  2. Calculate the load to weight ratio of your bridge.
  3. What were the individual maximum force values on each load sensor before failure?
  4. Identify on your bridge where the bridge failed. Take a picture of this point of failure and note its location.
  5. Based on the load data for the four sensors, describe why your bridge may have failed.
  6. What could you have done to increase the performance of your bridge?

The data really allowed for some rich analysis and the students were able to make some really informed critiques of their design and fabrication quality. We have been very happy with the results!

Future Improvements

For version 2.0 we hope to add these improvements:

  • Add the ability to measure deflection. We think that this might be done by measuring the angular displacement of the loading wheel, but we aren’t sure just yet.
  • Some way for the software to detect a failure – perhaps a way to detect a significant decrease in the load data. It would have to allow for some downward movement of the load data because there is some settling and deforming that can occur that might not be catastrophic.
  • It would be nice to clean up the code – especially the Processing code. I’d like to add some fancy GUI elements too so that it is a bit more attractive.

If you would like to build your own advanced bridge tester for your classroom, we can send you all our CAD files, software files and even answer questions. Its not easy to build, but its fun, and we spent about $350 dollars on this project as opposed to the $1000 to $1300 that the vendors are selling theirs for.

3D Printing and STEM Education

As the Maker Movement spreads into the halls of nearly every school across the country, and with it the technologies that tend to be synonymous with that movement, I thought it might be useful for me to write a reflection about how we have used 3D printing in our program and some of the things that others might want to consider when thinking about investing in 3D printing for their school.

What is 3D Printing?

A 3D printer is any device that uses additive fabrication to essentially create some three dimensional object by building that object layer by layer. Currently the most popular way to do this in the educational sphere (because it is the least expensive) is to build the models by extruding melted plastic – similar to having a very precise hot glue gun. This has been the technology that we have used for the past five or six years in the Academy. Recently there has been an explosion in new inexpensive models coming to market that use light to harden photosensitive liquid polymers. These technologies (known as stereolithography  and digital light processing – DLP) use a focused light source or laser to harden the liquid layer by layer. The finished model in most cases is made of some kind of plastic – ABS, PLA, etc. Although the technology is moving forward with other materials, any kind of printer that would be used in a classroom environment is going to make plastic models.

Whatever the process of the 3D printer, these technologies are different from subtractive manufacturing which starts with a “chunk of stuff” and then carves the material away, leaving the 3D model. These always require some kind of cutting instrument like a hardened metal drill bit, or even possibly a laser or high pressure water jet. These methods are still preferred for the actual manufacturing of things like airplane parts, high precision medical instruments and all sorts of other machinery because these methods are highly precise and can be used to create parts from almost any material – metal, stone, plastic, etc. There are two issues with subtractive manufacturing though. The machinery is generally very expensive and learning how to use it properly is quite challenging.

If you would like to learn more about 3D printing in general, I suggest this great website:

http://3dprintingindustry.com/3d-printing-basics-free-beginners-guide/processes/

Our Printers

We currently have three operational 3D printers and one new DLP printer that we are currently assembling. The first 3D printer that we purchased was a Stratasys uPrint:

This printer has served us very well. It builds very precise models using really solid ABS plastic. Its precision comes at a cost though – it is quite slow. OK, its really slow! A nose cone for a rocket can take upwards of six hours to build! The other drawback of this printer is the cost and availability of build/support material. We just bought a complete restock of material and it cost us nearly $1700! Keep in mind that this should last us about six years to eight years.

The other two models that we have are the ubiquitous MakerBot Replicator 2’s. These are much simpler to operate (when they aren’t clogged) and they are much faster. They are also much less expensive. The uPrint cost us about $20,000 dollars including the rinse tank, while each MakerBot Replicator 2 cost us about $2200. Actually one of the MakerBots was part of a DonorsChoose/Autodesk program that cost us nothing (thank you donors and Autodesk!). The material for these machines is much cheaper – about $90 to $50 dollars per spool, as opposed to about $200+ per spool for the uPrint. The drawbacks of these machines is that they need constant maintenance, manual calibration, and the models that they build are not as accurate nor as precise.

We recently were very honored to be the recipients of a new 3D printer, donated by our high school’s parent organization – WeAreSR. Although we haven’t yet been able to use our new 3D printer from Kudo3D, we are excited by its potential. This DLP printer is said to have a much higher resolution, a much faster build speed, and a very large build volume. We will be posting an update once we get it running – which should be soon!

Rapid Prototyping = Rapid Learning

The really rewarding educational aspect of 3D printing, from a teacher’s perspective, is the acceleration of the learning cycle. Students can quickly identify weaknesses in their designs because they can have a part in their hands in literally hours, then make adjustments and have a new version fabricated, sometimes in a single class period. This would be nearly impossible ten years ago.

Now some might argue that it relieves students from the importance of having to think more carefully about their work, but I think this is outweighed by the advantage of allowing students to more quickly assess their spatial reasoning, and as long as we teachers force the students to also reflect on why their design failed or needed revision, then I think ultimately the students will learn more quickly.

This does not mean that we always allow the students to print whatever they want. We do act as “gatekeepers” to the printers so that we aren’t wasting student time, our time and resources. The models must pass a few minimal requirements, such as double checking dimensions, seeing if the model could be made more efficiently as multiple parts, etc.

3D Printing = 3D Spacial Problem Solving

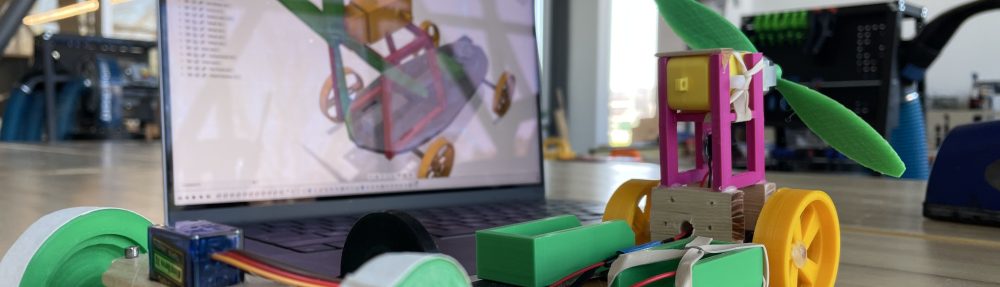
The 3D printers have acted as a great arena for students to learn and develop their 3D spatial problem solving skills. To be clear, its actually the combination of 3D CAD software used to design the models and 3D printing to create the actualized models that helps students visualize, navigate and anticipate interesting three dimensional problems. Generally, the printers are used to create parts that are then used in more complex assemblies. The interface of these parts is where we see students encountering and having to solve complex spatial puzzles.

One of the things that I have witnessed is the advancing complexities of student designs as they become more familiar with the software and also develop their ability to mentally construct the spatial relationships between assembly components. At some point, I’d like to document this process and perhaps develop an assessment tool for measuring the development of these cognitive skills.

The Limitations (Not Star Trek Yet…)

The really amazing aspect of 3D printing is the ability to create real objects from imaginary ones with an almost perfect translation. I do think that it is important to realize that there are some limitations and also some things to consider before you run out and buy one of these things. Here are few things to consider:

All Those Plastic Things

One of my biggest complaints to the 3D printing industry is the lack of any clear and clean way to take 3D printed models that were unsuccessful and break them down back into raw materials for use in the printer. At the end of the school year, we have a fairly large bin of unwanted models that we collect for recycling. Some of the models are indeed recyclable while others are not depending on the material used. I think the manufacturers need to come up with a clear “cradle to cradle” solution for their printers that allow users to throw their models back into the machine to be re-extruded. It is theoretically possible and at least one company is offering a product called the Fillabot for addressing this issue.

Its Not That “Rapid”

Now, in relative terms when compared to milling, 3D printing is pretty fast, but it is actually slow in the context of the classroom. Even though its called rapid prototyping, it can seem really slow for some folks who are new to the world of manufacturing prototypes. You see, in the past, modelers would make a prototype out of clay, create a mold, cast the mold, make refinements, etc. Or one would calibrate and setup the CNC mill, have to change out bits, run test cuts, etc. In this context, 3D printing seems rapid. But its still not Star Trek.

The time can vary significantly based on the type of the printer, the complexity of the design, and the size of the model. This can be really frustrating for some teachers who want to be able to print an entire class’ models and have them ready for the next class period – that won’t happen. It can take hours to print just one model. You have to design your course in a way that allows the students to work on parallel tasks and then you need to have some way of keeping track of the printing queue.

It Won’t Make Everything

These machines are amazing, and we really love our array of 3D Printers, but experience has taught us that there are limitations to what they can make. Because all of these printers essentially work with liquified plastic, there are limits to the geometry of what you can build. As the models are built, they can “sag” or deform under their own weight. This can lead to small deformities, or catastrophic failures. Calibration can also be an issue with some of the less expensive or older printers. If the build plate is not properly leveled and calibrated, the entire build process can fail. Models with significant “overhang” can collapse, ruining the model.

Different printers deal with this slightly differently. Our MakerBots, for example, add “supports” to the model. These are little posts that act to hold up arching forms. The problem with this is that these posts then need to be removed from the model, and we have found this to be less than ideal. It adds extra time to the process because you have to do some post finishing work which can include filing and some sanding. Our uPrint actually adds a soluble support to the model that can be removed using a mild (but still toxic) solution. Again, this post processing adds a significant amount of time to the entire fabrication process.

Size is also a limitation. Don’t think for a minute that just because the build plate is 8 inches by 6 inches, that you can build a model with that footprint. You can’t. Once again, because you are dealing with liquified plastic that cools, it also shrinks. The larger the volume of the model, the greater the chance that the model will curl, buckle, and deform. Read the fine print from the manufacturer to get the real build size limit.

Easier, But Not Easy

The last point we want to make is that working with a 3D printing is certainly easier than running a 5 axis CNC mill, but they are not as easy to work with as an actual 2D printer. Adding that extra dimension has its challenges. Plan on spending quite a bit of time learning how to maintain your printer. Just like 2D printers, 3D printers “jam” all the time. The extruded plastic can get stuck in the nozzle and you can come back after several hours of printing and find that the very last cm of the model never printed because the nozzle is completely gummed up! Be aware that these can be infuriating moments that take significant amounts of time to fix. I have spoken to some teachers that got so frustrated that their printers ended up just sitting in a corner of the classroom, tragically unused.

Our Recommendations

Our recommendations are simple. Before you go out and buy one of these things, you have to be willing to put in quite a bit of time to maintain it and learn how to optimize your printer’s performance. There are tricks to optimizing each printer out there, and it will require that you watch some YouTube videos, dig through online support forums and be patient.

There are clear and obvious reasons to get one of these if you are running a STEM program, especially one focused on engineering or design. What might not be obvious is that these machines can also be incorporated into mathematics education, and definitely into a 3D art course or sculpture course.

There are so many models out there now, and they all claim to be the very best value. Each will obviously have advantages and disadvantages. Ease of use and less expensive generally means that your models will not be as precise or accurate. Inexpensive models can also be difficult to maintain. DLP printers are looking promising. They are coming down in price, they are faster and they are very precise. They can print models using different materials (like castable resin, or flexible resin). On the other hand, keep in mind that they are still more expensive, and they use a somewhat toxic resin that can be a non starter for some teachers.