Modeling A Physical Pendulum – Another Adventure in Coding Nature

Rotational Dynamics Are Difficult to Learn… and to Teach

One of the most difficult units for AP Physics students is rotational mechanics. It can also be one of the hardest to teach. With that said, I really like rotational mechanics, but I want my students to enjoy it more. I want them not be be bogged down in some of the more difficult theoretical aspects of the rotational motion. There are several reasons for this topic being challenging I think – the use of the polar coordinate system, the introduction to the concept of a distribution of mass as opposed to just thinking about objects as point particles, the cross product of vectors producing a result pointing in the Z axis…yikes, it can get pretty heavy.

As a teacher, it is also tricky to come up with good investigations that allow students the opportunity to explore rotational dynamics. They do exist, and some are really good, but I also think that many don’t exactly build a strong link between the conceptual and mathematical models. Rolling a ring and a disk and sphere down a ramp can be a great demonstration that things that roll certainly do not behave like blocks or carts moving down a ramp, but its hard for the students to explore further – to build a predictive model that is mathematically precise. The normal way of things is to jump into the math and reveal the underlying mechanics through fairly complex derivations.

Simulating The Angular Momentum Principle

This year I decided to turn to a computational approach. I wanted the students to computationally experiment and discover the fundamentals of rotational mechanics. In order to do this, we started from the Angular Momentum Principle. This is the approach used in the wonderful textbook Matter and Interactions:

Στ ·Δt = I·Δω

The idea here is simply that a torque acting on an object (that is free to rotate around a pivot point) for a specified amount of time is going to cause an object to experience a change in its rate of spinning – called its rotational velocity.

Simulating A Physical Pendulum

Having the students start with this principle, they could learn some interesting mechanics of rotating bodies by building a simulation of a physical pendulum. A simple pendulum is “simple” in that it represents a single point mass hanging on a massless string. A physical pendulum has physical dimension, and so the body has to be modeled as having a distribution of mass. This gets really tricky to analytically model – especially the time dependent functions describing its motion.

But with a computational approach students could easily apply the momentum principle frame by frame. The students in my class were able to create a simulation of a physical pendulum in just over one class period. The pendulum that they modeled was a bar with weights at either end. The weights had different masses so that the bar would swing.

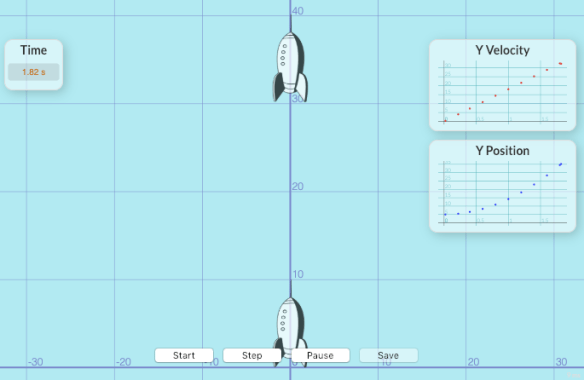
https://tychos.org/scenarios/250

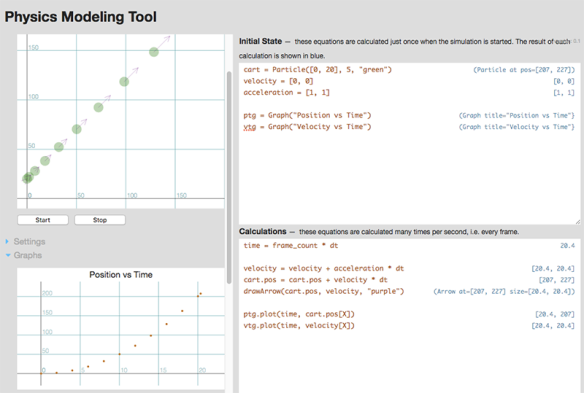
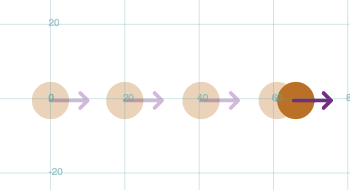
The students set about building their simulations in Tychos – a web based simulation builder. As the students coded the simulation, they were continuously engaged in discussions about the mechanics of the code and the mechanics of nature. I asked the students to change the masses, or change the length of the bar, or the mass of the bar. They would run their simulations and discover that something didn’t quite match what they thought should happen. Students would then look for errors in the code, or they would question their own assumptions about the physics involved.

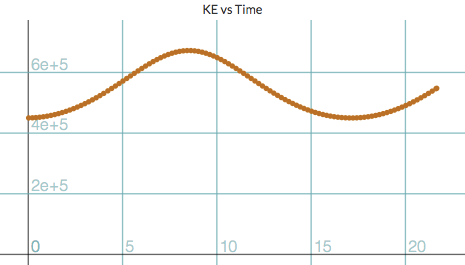
When they finished their simulations, and they were confident that their simulations were working, I had the students then use the simulation to investigate the energy of the rotating system. After some discussions about the transference of energy from the gravitational field to the kinetic energy (rotational) of the bar and the weights, the students discovered that their simulations also seemed to model the conservation of energy.

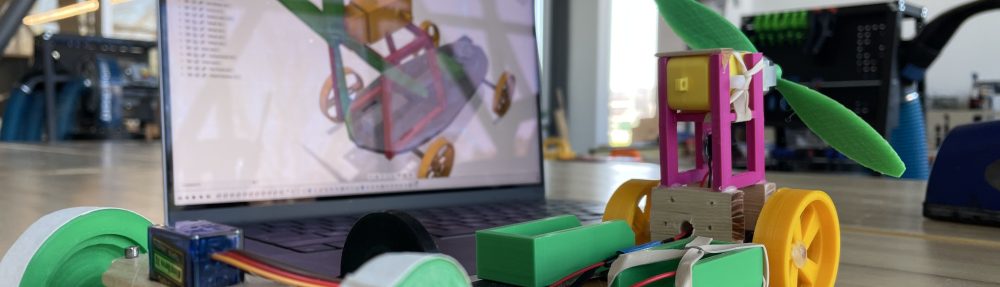
We didn’t stop there though. We had to see if the simulation did indeed match reality. This is called deployment in the modeling pedagogy. Using a meter stick, some disks that I had made for an earlier investigation, and a Vernier rotational sensor, I constructed a real physical pendulum.

To test the simulation, students were asked to identify all the inputs that would need to be measured and then entered them into their simulations. The students then used the conservation of energy to calculate rotational speed of the bar when the bar was released from an angle of 60 degrees – with the heavier weight above the lighter weight.

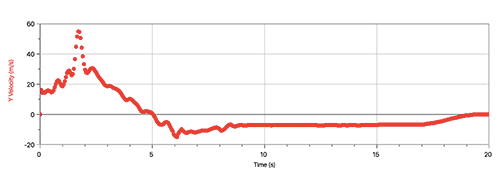
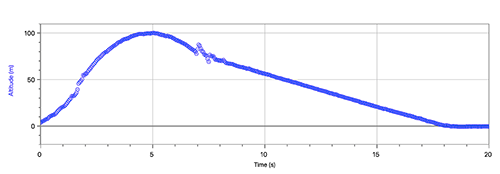
The students calculated a final rotational velocity of 2.8 radians/second. We then ran our test and graphed the angle of the bar as well as the rotational velocity of the bar (see graphs below). They measured a rotational max velocity of about 2.6 radians/second. The students were pretty satisfied with this result.

omega_graph

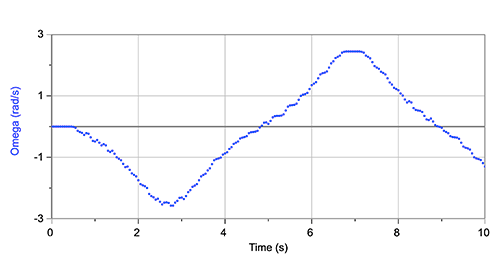
angular velocity of the bar

theta_graph

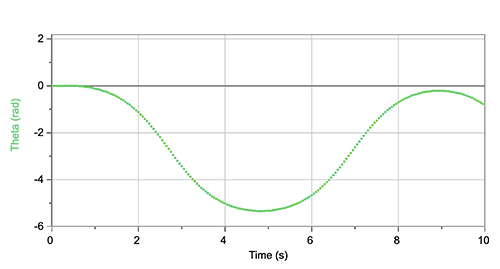
angular position of the bar

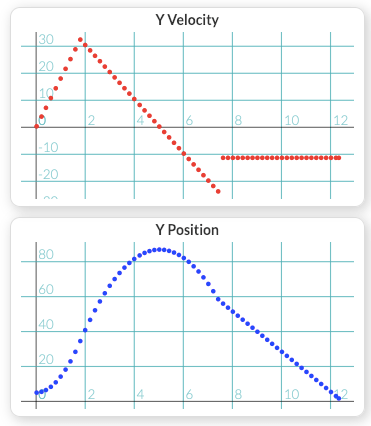
I then had the students graph the results of their simulations, and it was quite satisfying to see that the simulations and the sensor readings were matching really well.

sim_phys_pendulum

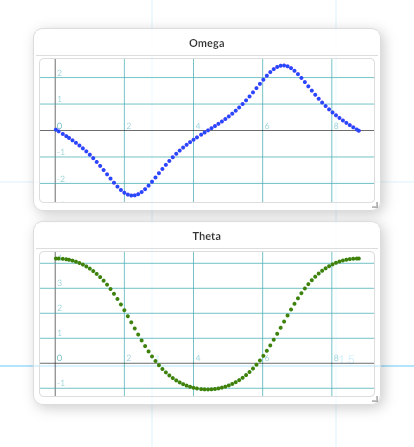
graphs produced in Tychos

This led to some more interesting discussions around simulating axel friction and air resistance. We also discussed the shapes of the graphs and what might be going on with their mathematical structure. This was far more interesting than just having them read out of a textbook and then solve some problems on paper, and my guess is that the students gained an understanding of the physical mechanics by having to debug their own simulated mechanics. They were able to investigate errors in their own code, but by doing so, see how the position of the weights, and the masses and the angle changed the behavior of the simulation and the motion graphs. I think the students also really enjoyed this approach, and based on how they were talking about their simulations and the experiment, they demonstrated to me that they had grasped a deeper understanding of rotational mechanics.


Computational Deployment: Simulating A Rocket

The model rocket project has long been a favorite at the Academy. For the past fifteen years, students have designed, fabricated and then launched model rockets as the first project of the program. Over the years, I have tweaked the project several times, each time finding new ways to introduce authentic analysis in the process.

This year I have taken a deep dive into computational modeling, and as part of the rocket project, students were asked to create a simulation of their rocket prior to launch. In this post I will discuss how I did this, and how it turned out.

Simulating The Momentum Principle:

Prior to getting started on this, students investigated the causal relationship between forces and changes in motion. Using force sensors, carts, weights and elastic cords of different lengths, students began building a qualitative and quantitative model relating the momentum of a particle to the forces acting on the particle.

Screen Shot 2018-12-22 at 9.27.05 AM

In previous years, I waited to introduce momentum until after a significant amount of time was spent on forces, balanced and unbalanced. This year I decided to go directly to momentum. This is a bit of a break from the established modeling instruction sequence, but I think its a good alternative that is also suggested by the great textbook Matter and Interactions. The momentum principle can easily be modeled computationally and I think the students are able to grasp it conceptually.

I have included a link to a Google Doc that is the introductory activity that I created. My approach here, as it has been with this entire unit is to give the students guided questions that allow the students to discover and investigate the code required to simulate the momentum principle. This is my first attempt, and I am sure it will undergo many revisions:

Simulating The Momentum Principle

Introducing Conditional Behavior

One of the really great things about building a simulation of a rocket has three distinct phases of its trajectory – the thrust phase, the cruise phase and the descent phase. This gives the students three different phenomena to study and simulate: positive acceleration when two unbalanced forces are acting on the rocket during the thrust phase, free fall when the fuel runs out, and then constant velocity when the parachute has been deployed.

In order to simulate this, students needed a way to change the forces acting on the rocket at different time intervals. This is done using a conditional statement:

If This Then That

Conditional statements are very easy to create in Tychos – but they work a bit differently from other programming interfaces. Here is an example:

# The thrust force - F (thrust, rocket, fuel)
Ftrf = if (t < 1.8, [0, 6], [0, 0])

In this code snippet, a force is given a different value based on a condition, in this case whether the time in the simulation is less than 1.8 seconds. If it is, then the force is given a positive 6 value in the Y direction, and if the time is greater than 1.8 seconds, then the force becomes zero.

This allows the students to simulate the thrust phase of the rocket by having the thrust force disappear once the fuel has run out. We conducted tests on Estes C6-5 rocket engines in order to establish the time value. You can read more about how we did this here.

The students did the same thing to figure out when the parachute should deploy. Again this was established based on information from Estes as well as our own tests.

Comparing Simulation Data to Real Data

The students could analyze the simulated rocket behavior by using the graphing tools in Tychos. The students graphed the vertical velocity as well as the vertical position of their simulated rockets. Here is an example of what those graphs look like:

Screen Shot 2018-12-22 at 10.22.21 AM

The last step of the process was for the students to compare their simulated data to the real data that was captured by the altimeter that we use in the rocket’s payload. Below are two images of the graphs of the data they retrieved from the rocket’s altimeter:

rocket_v_graph

velocity data from altimeter – imported into LoggerPro

rocket_y_graph

altitude data from altimeter – imported into LoggerPro

The shapes of the graphs from the simulated data and the real data are very similar! That was certainly exciting to see that the simulations were at least giving results that qualitatively matched the real behavior of the rockets.

Two factors that certainly created significant discrepancies between the real rockets and the simulated rockets was the existence of air resistance on the real rocket, and the fact that the real rockets didn’t always go perfectly straight up! We plan on modifying the simulations, but that will have to wait for a future post.

Recruiting the Girls.

18485799_1373393066108921_6346993731891607211_n

This post was written by Johnie Lee Fain, a recent graduate of San Rafael High School and the Academy. She is currently planning on studying computer science at Villanova University


I spent three years of my high school career in the engineering lab, and at most, there were six other girls beside me.

As a high school senior presented with the challenge of choosing an engineering project to research and produce as the focus of my third year in the Academy I turned to my own experience. I wanted more female students to discover an appreciation for not just STEM studies, but applying it to their own interests, whether that be art, fashion, literature, etc. Based on my opportunity to work with physics, fabrication and design, and computer science, my goal was to reach out to other girls, and facilitate a community of exposure and collaborative thinking for female students on campus and their varying degrees of interests in a STEM education. I then took this inspiration and used programming as my platform.

The graph below shows the enrollment ratio of male to female students From the 2013-14 academic year to 2016-17. 

graph

After initial research of the outstanding gender gap in science based fields, I focused my project development on the San Rafael High School campus specifically. Aside from my own opinions, I sought to learn and understand the experiences of my female peers in STEM as well as those who showed little enthusiasm about the subject. Thus, a discussion group was created to pair girls with little to no experience in STEM, with another eagerly involved student. This transition sought to introduce topics of discussion, and create a space for learning, project development and sharing of peer to peer experiences. Through this I sought to introduce Science, Technology, Math and engineering as an opportunity rather than an unknown.


girls_screening

SRHS Girls at the screening of CODE: Debugging the Gender Gap

There was a larger emphasis on social participation in my project than I had expected initially. I found myself talking to administrators, talking to younger students, and researching new ways to encourage young females than focusing on the technical aspects of my project. It is safe to say I underestimated my ability to create a recruiting website from scratch when I was still learning the basics of Computer Science. This deficit in what I thought was my only was to reach out to the community was in fact an example of the very work I was trying to emphasize. That while learning something new, I could share my thoughts, work and progress withe the girls around me.


Outside of San Rafael, I found mentorships and employment opportunities to help guide my project. Under the guidance of Ryan Robinett, a former partner at the software company Digital Foundry, I was able to visualize what I was attempting to accomplish in website design in the “real world.” This exposure not only broadened my understanding of the complexity of computing but as well as its team based nature. I felt somewhat vindicated in my struggle to produce something original when on a day to day basis software engineers are working in groups almost entirely. Additionally, my employment as a coding instructor at Mill Valley Code Club, a program designed to teach elementary through middle school students how to computer program, I was practicing how to explain and teach the vary programming fundamentals I was learning to a younger audience. Certainly solidifying the material I knew, and highlighting what I had yet to understand.


Ending the year I found I had not only exposed myself to programming in a variety of ways but had introduced the importance of collaborative thinking and communication amongst the female students and their envelopment in STEM education. Moving forward, the importance is consistency. Through deliberate action and communication, the next batch of San Rafael High School Engineering Academy graduates have an opportunity to continue to close the gender gap and inspire others.

girls_screening2

SRHS girls meeting the film maker of She Started It

Helping Students Create Their Own Mini Universes

For the past year, I have been helping a small software development team, headed up by my friend Winston Wolff, in the creation of a web based physics simulation tool. In this blog post, I am going to describe:

  • Why we started this effort,
  • What we hope to achieve,
  • How far we have currently progressed towards our goals,
  • And invite you to try it out.

Simulations Can Be Helpful…

Many Physics teachers use computer simulations as a tool to help students learn physics. With a click of the mouse and a few keystrokes, students can quickly change the inputs to the simulation, producing different simulated behaviors of the system. This allows for quick exploration of the relationship between certain “physical” inputs and the governing dynamics of the system. Often, these explorations would be impossible to set up in the lab, or might take significant time and effort.

projectile-motion-600

A great PHET simulation of projectile motion

…But They Have Limitations.

Although these tools can be used with a high degree of success in the classroom, the students are interacting with a virtual universe created by another human. The rules of behavior and the underlying quantitative relationships have been defined by someone else who has already done the difficult work to model the physical universe. These relationships can be inferred and they can be explored by the student, but ultimately, they are hidden behind an impenetrable wall of software code. There is also a certain faith that the student must have in the simulation – there must exist an acceptance that the simulation creators did their job correctly.

Students Coding Their Own Simulations is Awesome… 

Some highly regarded physics educators have introduced the practice of teaching computer programming in the physics classroom. The advantage of engaging students directly in the construction of simulations, according to Ruth Chabay and Bruce Sherwood

is that there are no “black boxes”: students write all of the computational statements to model the physical system and to visualize the abstract quantities.”

Additionally, they argue that having students gain some experience and exposure to computational modeling

in the form of programming, even at the introductory level, can be an important component of a general education for living in today’s world.

Giving students the opportunity to write their own simulations gives them the ability to engage in computational physics directly and to give them vital experience in one of the aspects of being a scientist – namely writing some code.

… But There Are Challenges For Teaching Coding.

Although there are great reasons for integrating computer science with Physics, and therefore developing students’ understanding and experience with computational Physics, there are some significant challenges for the teacher.

Teaching students to code their own physics simulations is not trivial. It requires significant instructional time, even given the fact that there are some amazing tools and frameworks for graphics programming (VPython, Processing). Chabay warns that time spent on teaching computer science principles and practices needs to be assessed against the time lost teaching and learning physics.

Due to the complexity and in many cases, the lack of exposure to computer science and “coding”, students can become lost in the syntax and specific computer science discourse, thus leading to confusion about the actual physics principles.  


phymod1

A Hybrid Solution Is Needed: Tychos

Tychos (tychos.org) attempts to address the strengths presented by simulations and combine it with the value of computational modeling. It is a simulation tool that has been built to address the lack of transparency inherent in pre-constructed simulations while also simplifying and accelerating the acquisition of the skills needed to “code” the underlying physics.

We have never seen Tychos as a replacement for laboratory experiments. Quite the opposite, we see this as a way to enhance the laboratory experience. It gives students the ability to quickly define a hypothesis in code for anticipated behavior of a real experiment. Students can then run the real experiment and see if the simulation behavior that they defined matches or does not match the behavior defined by nature.

No Black Boxes

The rules of the simulation are created and coded by the student. At its base, Tychos is really just a “drawing” and computational tool. There are no “virtual physics” built into the environment. Those rules must be defined and implemented by the student.

For example, if a student wants to simulate a particle moving in space with a constant velocity, they simply need to define the particle by using one of the few built in functions to place the particle at a position, set its visible size, and then optionally display with a given color, in this case the color red:

p = Particle([0,0], 10, "red")

The “particle” is really just a graphic “dot” that appears on the screen. The simulator has no concept of movement, or mass, or energy, etc. The student must build in those rules. So for example, the student defines a numerical matrix to represent the particle’s velocity:

p = Particle([0,0], 10, "red")
p.vel = [10, 0]

Then the student can use that variable to define how the particle will move in time. This is done by utilizing one of the few built in physical variables in the simulation software – “dt” which represents delta time:

p = Particle([0,0], 10, "red")
p.vel = [10, 0]
p.pos = p.pos + p.vel*dt

With these three lines of code, a student can simulate a particle moving in space with a constant velocity. The student makes that happen and therefore the mechanics of the behavior are not hidden but rather fully exposed for the student to define.

Built In Physics Analytical Tools

We have tried to create an environment where students have access to a suite of analytical tools that either do not require any coding, or very little.

Visual Representations

As we develop Tychos, we are constantly looking at how we can make the tool easier to use for students. A few features that we have included are important visual representations that are commonly used to help represent motion. For example, we have made it very simple for students to see motion maps of their particles by simply clicking a button. We have also made it very easy to display vector arrows for any vector quantity, and to attach those vectors to a given particle:

cvpm_canvas_6

This allows students to quickly assess the behavior of the simulation without needing to spend time learning how to implement complex tools.

Easily Adjust Simulation Parameters

We have also tried to remove any coding that isn’t specifically targeted at modeling physics. For example, Tychos has a simple set of simulation parameters that can be changed with a few simple controls:

settings

The above panel shows that a student can change the frame rate, the motion map strobe rate, set a simulation stop time, and change the extents of the viewing window – all without writing a line of code.

Coding of the GUI, rendering graphics, running the animation, etc are taken care of so there is less to program. The programs are much shorter and the code is more focused on the physics concepts, e.g calculating how force and momentum affect the position of a particle. There is no “boiler plate” code that needs to be used to get started which we have found to be cumbersome and confusing for students. Students spend less time learning programming and more time learning physics.

Graphing

One of the great features that we are excited about and that I have found incredibly useful in class is the built in graphing tools in Tychos. With two simple lines of code, a student can graph any variables on a simple to read graph.

This allows for the student to graph the position, velocity,  and acceleration of a particle as a function of time (called motion graphs) but they can also graph energy, momentum, force, or any virtual quantity defined in the simulation code.

In the following example, the student has defined the kinetic energy of a particle and then has defined and displayed a graph for how the energy is changing with respect to time:

KEgraph = Graph("KE vs Time")
KE = 0.5*p.mass*p.vel*p.vel
KEgraph.plot(t, KE)

The graph then looks like this:

graph

This graph appears just under the simulation window, and the student can then easily connect the behavior of the simulated particle to the behavior of the graph.

Integrated Formative Assessment:

Tychos has been built around the concept of a learning system. From the ground up, we have built in features that are designed to engage the student in the learning process. Tychos includes fast feedback in the form of instructor defined goals which are checked by the system such as “Your simulation should calculate position of particle at time 3 seconds.”

goals

These goals keep students on track and allows for students to self assess. We have also noticed how these goals make the learning exciting. Students have expressed how much they enjoy watching the goals turn green as they accomplish them.

Teachers can also use the Goals as a quick and easy way to assess the learning progress of the entire class, and then focus on individuals that are having trouble. The teacher has the ability to peer into the individual student’s work and we are even building into the application the ability to see a “code history” of each student so that the teacher can track down the origin of a learning challenge and then direct the student to a specific solution.

Our Roadmap

We think we are off to a great start with this app, but we also realize that there are a number of great potential features that we hope to add. This is a rough outline of our future goals:

Tracking Student Progress

Soon the tool will show each student’s progress in realtime to the instructor so the instructor can maximize their time helping the students who need it. The tool will also allow instructors to see the work each student does, e.g. each attempt the student has made, the difference from the last attempt, and its outcome to help the instructor quickly deduce where the student’s thinking is and what is blocking her. Additionally, the instructor will be able to automatically export assessment data based on instructor’s defined criteria.

Custom Defined Classes

We want to give the students the ability to define reusable components so that we can further reduce the amount of code that is needed to create a simulation. We are working on some strategies to build that into Tychos.

Data Export/Import

To extend the connection between Tychos experiments and in class laboratory experiments, we intend to add the ability to export and import data to and from other data collection software like Logger Pro. This will allow more precise comparisons between simulated behavior and measured behavior from motion detectors or force sensors.


Looking For Feedback

We are continuously looking for ways to improve our application, and we have no shortage of ideas. Our next challenge is finding the time and resources to make those future enhancements possible, but we are eager to have other Physics teachers try this tool out and let us know what else we should do to make this a better learning and teaching experience.

If you are interested in trying this application out, please visit our website: tychos.org. If you would like to give us feedback, or have questions, please feel free to post a comment on this blog post or contact me (stemple@srcs.org) or Winston (winston@nitidbit.com). We would love to hear from you!


SRHS Girls Who Code

Discovering The Crisis in Computer Science

Last week, a group of 16 girls, myself and one other instructor were invited to attend the showing of the documentary film CODE: Debugging The Gender Gap. This excursion was hosted by the Mill Valley Film Festival and included a post showing discussion with the filmmaker Robin Hauser Reynolds. We traveled to the Lark Theater with another group from our neighboring high school Terra Linda. Our group represented all the currently enrolled girls in STEM courses that offer some exposure to the field of Computer Science. The Terra Linda group was composed of both boys and girls who participate in an after school “coding” club, but none of these students are actually enrolled in a course that offers them academic credit in computer science because no such course is offered at Terra Linda.

IMG_2531Once we arrived, we sat back and watched an inspirational, sometimes shocking, movie about the state of Computer Science education and the lack of opportunities afforded young women in this ever important career field. Although there are many companies and academic institutions that are attempting to address these issues, the United States still lags behind many countries and the numbers, especially for girls and under represented populations, are still appalling.

The Numbers Are Bad For Everyone

For example, according to the movie (and some quick research I conducted), only 10% of all American high schools actually offer any courses in Computer Science, and only 5% offer the AP Computer Science exam. One would think that the numbers in California must be better than the national average because, after all, we are the center of the technology boom, right? Well, according to the numbers presented by ECS and the College Board, California isn’t doing very well either: “In California, less than 1 percent of all advanced placement exams taken in 2011 were in computer science”. The shocking thing about this statistic is that since 2011, there has actually been a decline in the number of students taking Computer Science courses in high school.

They Are Worse For Girls (and Abysmal For Students Of Color)

To make matters worse, the numbers of girls who took the AP Computer science test made up only 21% of the the original 1% of AP test takers. That’s .21% of all students taking AP tests. Of the over 320,000 AP tests taken in 2011, about 3100 were AP Computer Science, and only 650 were girls. That’s really bad, but consider that in 2011, of the 3100 AP Computer Science test takers, 29 were African American.

The Numbers In Marin Are Bad Too

The numbers of students being exposed to Computer Science in the San Rafael School District is somewhat typical of the national trend, but it does seem a bit strange considering our proximity to Silicon Valley. We have tech firms all around us, but so little of that energy and intellectual power seems to be trickling into the public school system.  Oddly enough, its not just a problem in the public school system. Many of the prestigious private schools in Marin don’t offer robust Computer Science programs either.

Terra Linda doesn’t have a single Computer Science course, and San Rafael just added one two years ago which is strictly an introductory course to the field. Neither high school offers an AP Computer Science course. The middle schools in our district are starting to offer some exposure to coding, but still are lagging far behind where they need to be.

Some Possible Reasons

There are some reasons for this that are systemic and institutional. For so many years, No Child Left Behind emphasized Math and English to the detriment of almost every other content area. Students were enrolled in double Math and double English classes in order to get their scores up on state wide tests, and enrollment in other classes like CTE and Art declined. Another problem is teacher certification. In the state of California, the AP Computer Science class is considered a Math class, so only teachers certificated to teach Math can actually teach this course. There has been a push to change this, through a supplementary authorization, but currently in the state, even if you have a degree in Computer Science, you can’t teach the course unless you have a credential in Math. The other problem is more philosophical. I am not sure if we should be seeing Computer Science as its own separate endeavor, but rather should be seeking to integrate CS into Math and Science and Econ. curriculum.

The other problem is actually due, ironically, to how financially successful a person can be if they possess a Computer Science degree (or other technical degree). Its hard for school districts to attract a teacher with these skills when they can get a job working in the tech industry that now typically have starting salaries in the six figure range.

What’s Next – SRHS GirlsWhoCode

After getting off the bus, the girls were clearly affected. And I wanted them to consider doing something about it, but I wanted them to take charge. I knew their ideas would be better than mine, and so the girls got together for a post viewing meeting and discussed what they wanted to do at our school to address this problem. The other instructor and I left them alone, and they proceeded to come up with a plan. They captured their ideas and now they are set to meet with the school’s counseling staff. These girls are an amazing group of highly motivated and talented people and I have no doubt that they are going to come up with a great plan. I’ll be updating this post as soon as an official plan takes shape. I look forward to helping them debug this problem.