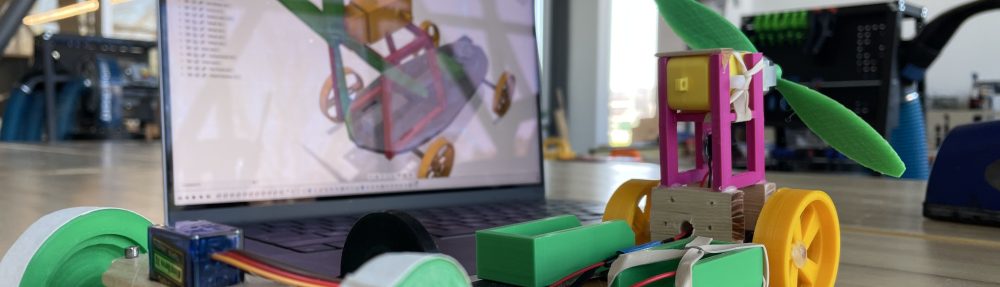


This is a follow up post to Modeling A Rocket’s Journey – A Synthesis where I described how the students in the first year program were engaged in creating a predictive report for their model rockets. I want to emphasize that these model rockets were not kits. Each rocket was designed using 3D CAD software, and each component was either fabricated from raw material, or was created from material that was not intended for use in model rocketry. The only exception to this is the actual rocket motor.
The next step was to launch the rockets and have the altimeter payload collect altitude data.
Launch Conditions – A Bit Soggy
Unfortunately the week of our scheduled launch happened to be a week of some pretty hefty rains. We rescheduled the launch twice before finally accepting the soggy launch conditions. With umbrellas and rain jackets, we trudged out to the baseball diamond and got to work setting up for the launch. We had some minor difficulties in the wet weather, but eventually had a very successful launch day.
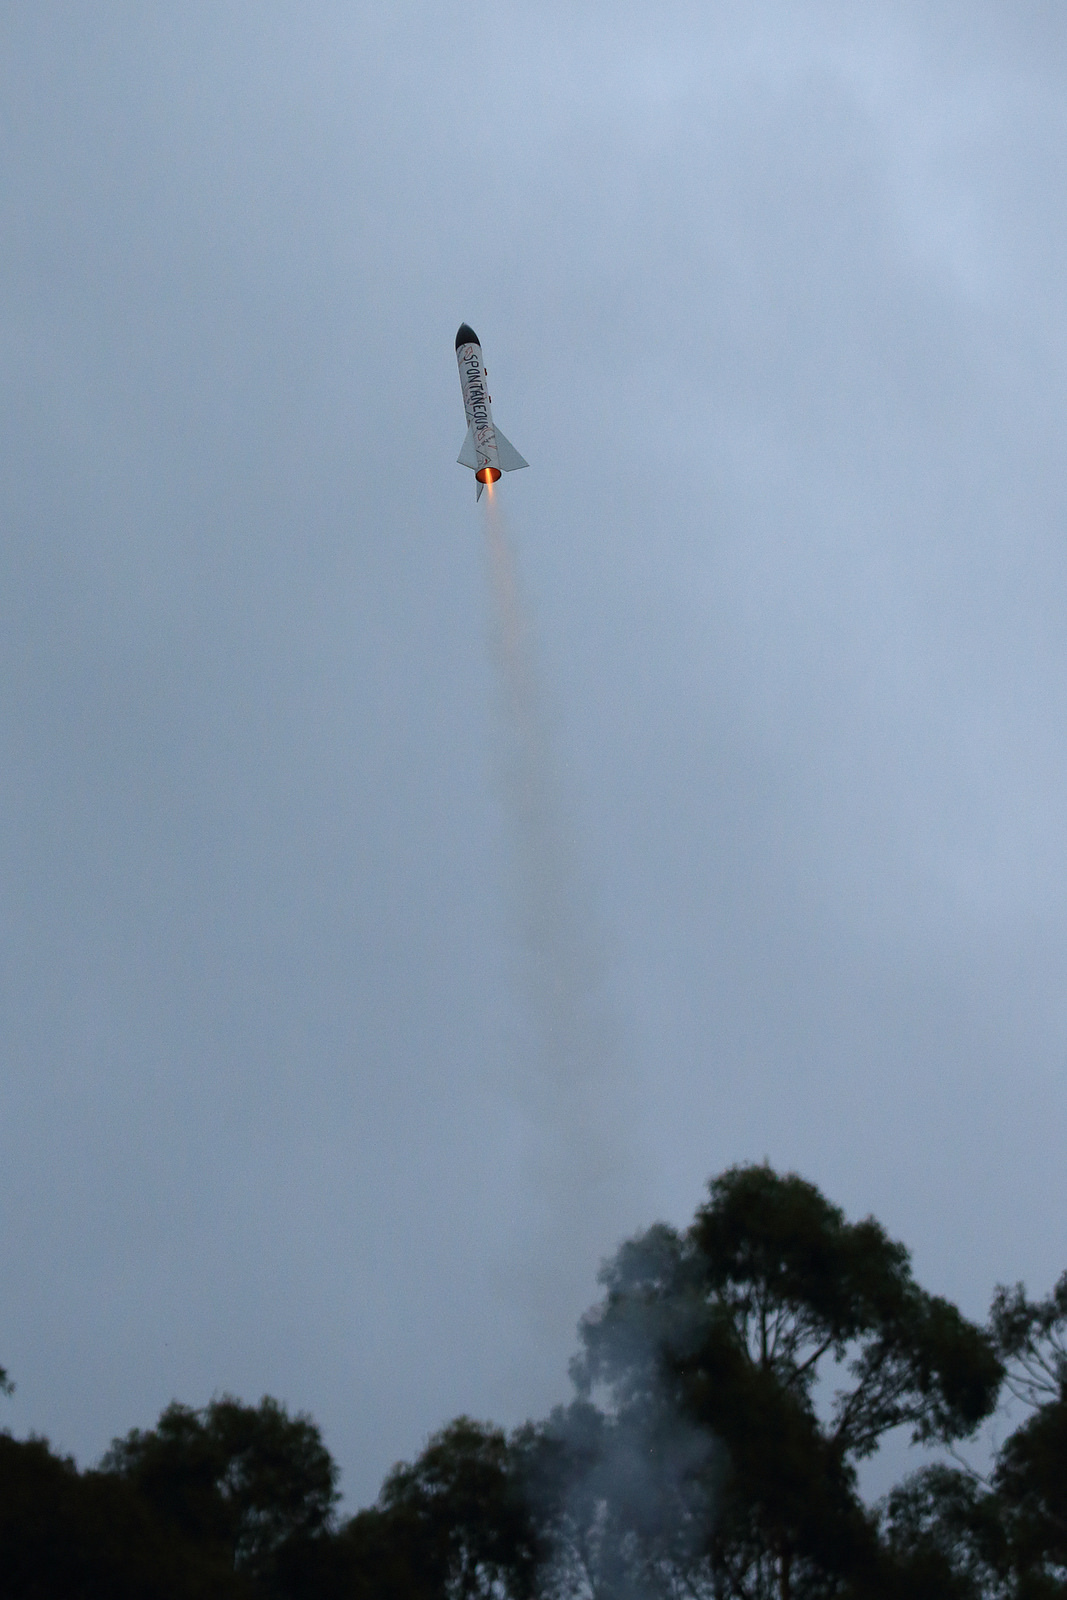
Most of the rockets were able to launch and deploy their valuable payload – the Pnut Altimeter.

The students seemed very excited to finally see the rockets launch, and to see the successful deployment of the parachutes. Although we all got a little wet and muddy, we had a great time!
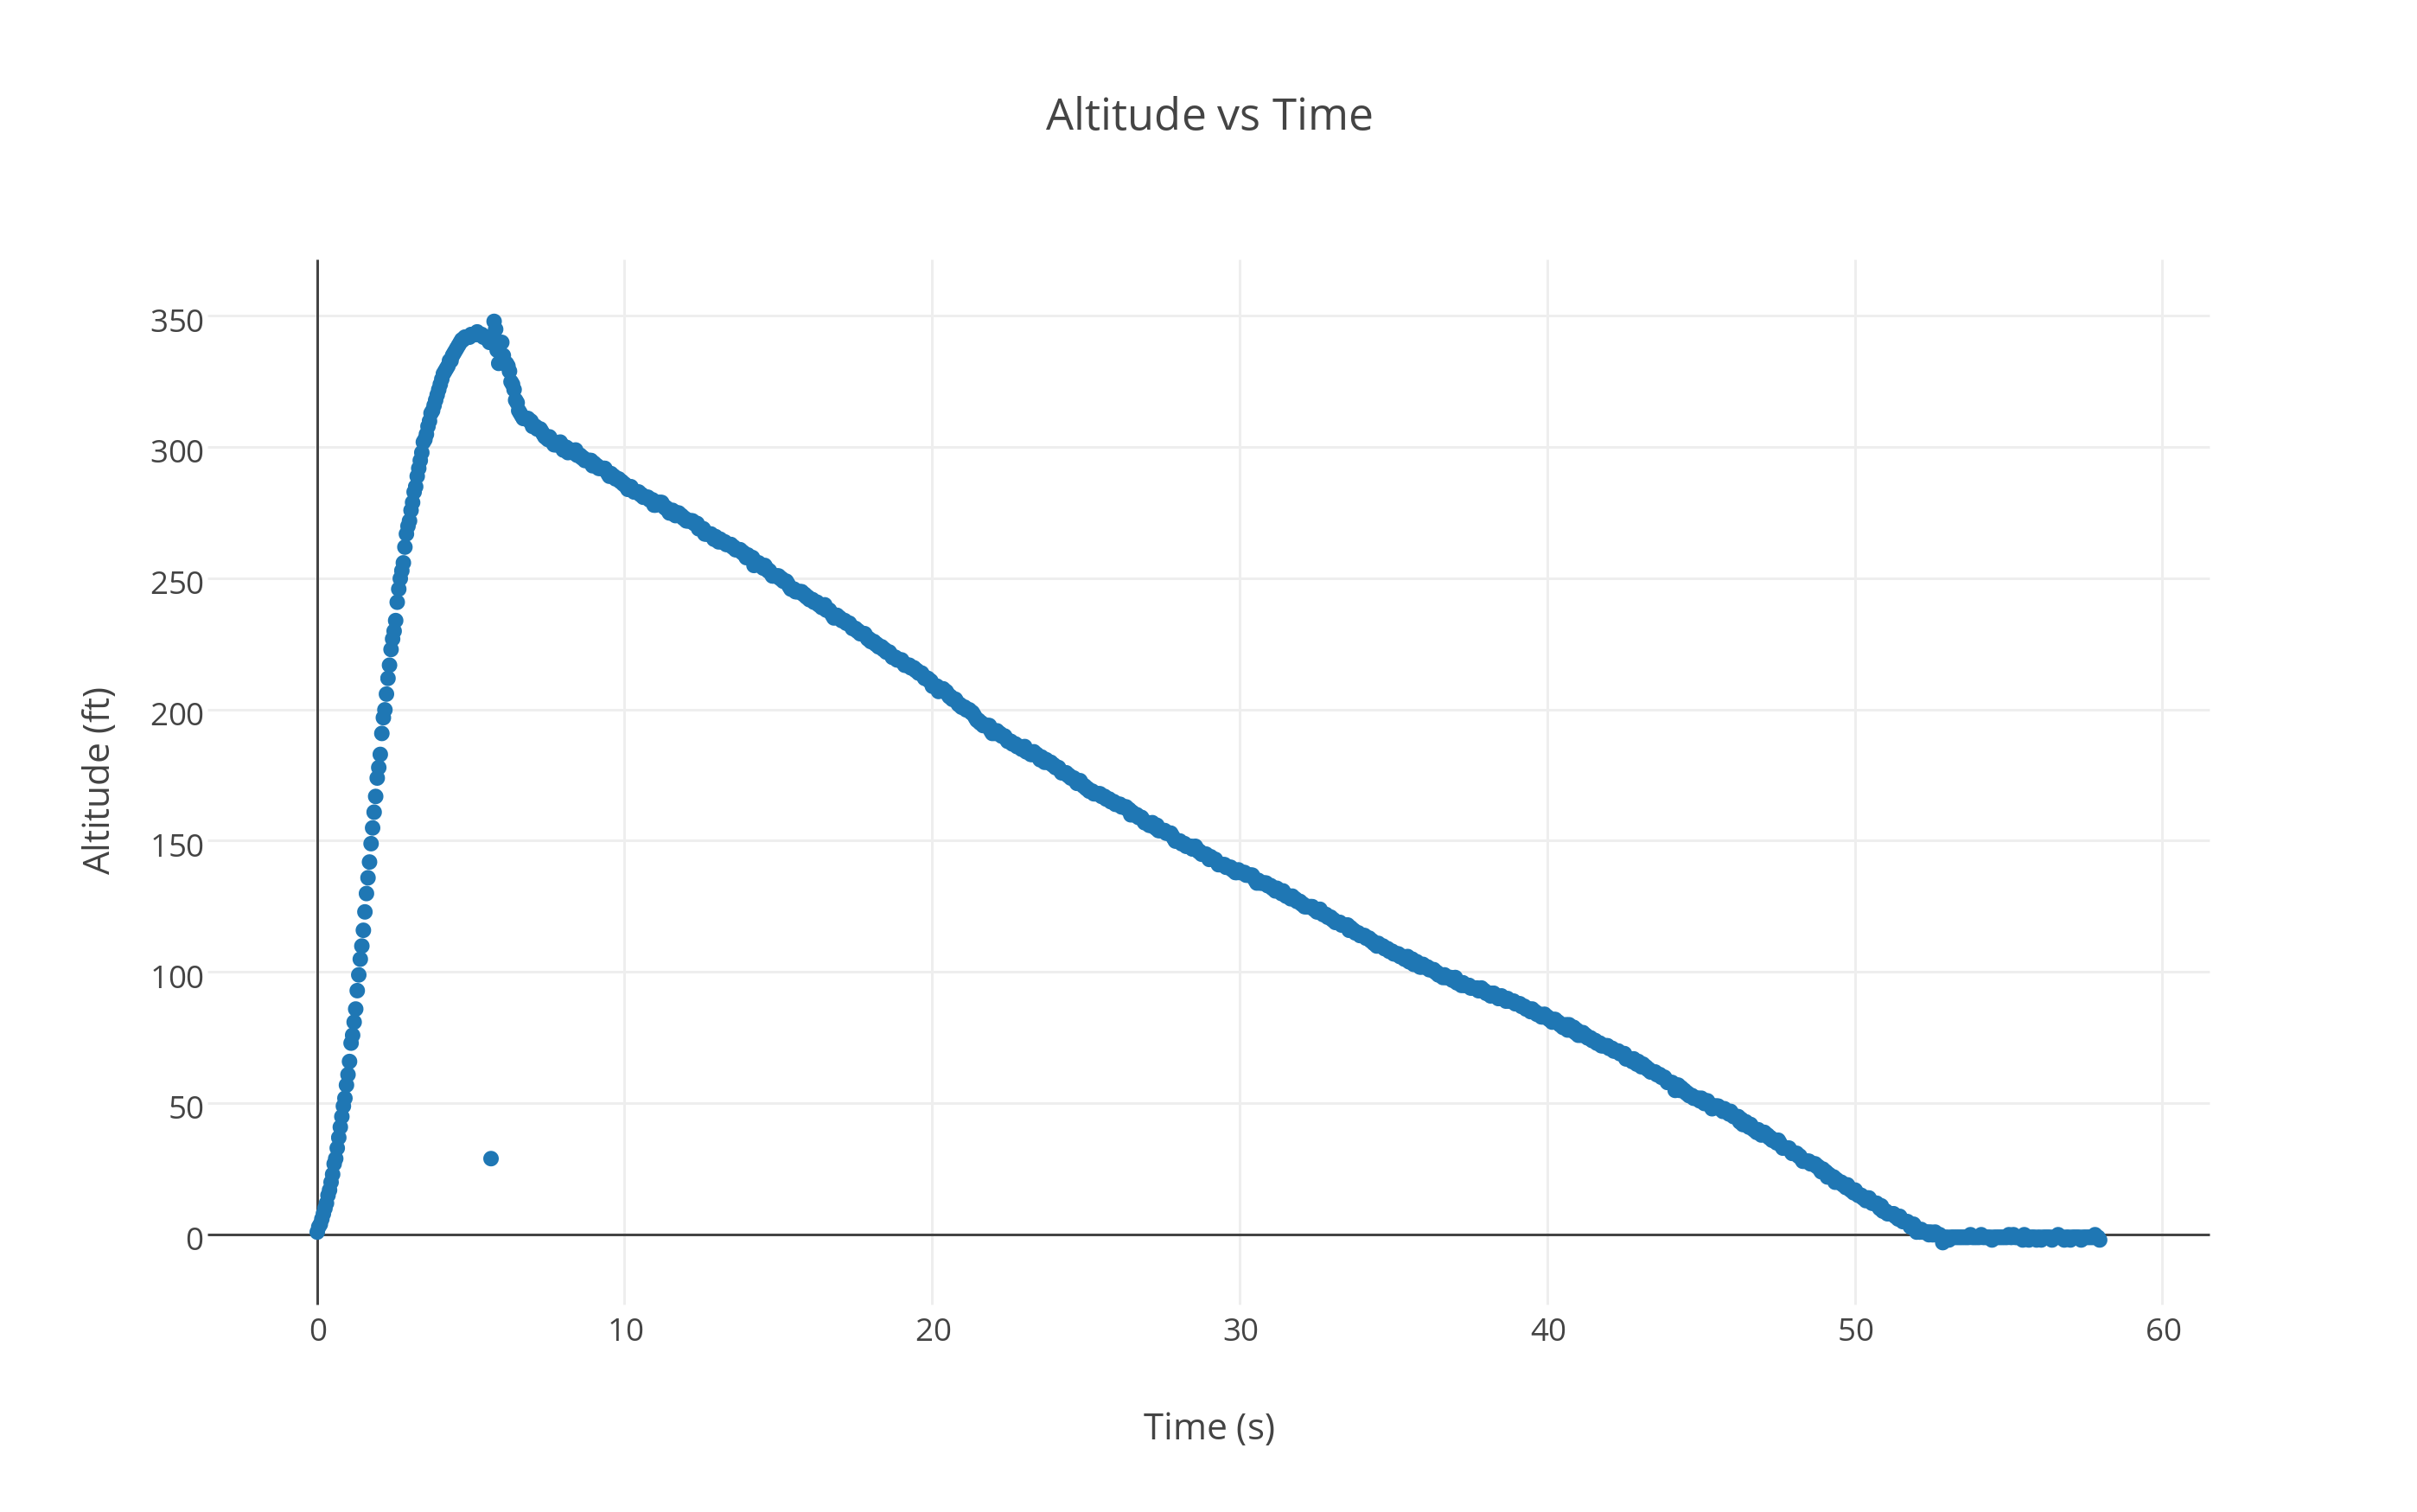
The Altimeter Data
The altimeters use a small barometric pressure sensor to collect altitude data (the altimeters also contain a small temperature sensor and voltage sensor). The altitude is recorded in feet every .05 seconds. Here is an example of one rocket’s recorded flight data:
The students were then asked to use the data to create a comparative analysis report. I will detail how the assignment was set up and also discuss how the students performed on this assignment. That will be for another post.
I want to also thank Mr. Kainz for his amazing photos that are displayed here.
