A Modernized Bridge Design Contest

IMG_0283

Modernizing An Old Classic

We have just completed the second project in the Academy for the 2014-15 school year. It was a huge success! This project takes a classic physics project and “upgrades” it by incorporating modern engineering design technology and fabrication techniques.

We started with a great project that is now available online through Engineering Encounters. This was a project that was originally published by Stephen J. Ressler of the United States Military Academy. It is a rigorous approach to designing and building bridges from file folders:

https://bridgecontest.org/resources/file-folder-bridges/

Its a great project with an incredible set of resources, background information, and step by step instructions. Unlike less rigorous and involved bridge design projects (using toothpicks for example), this project has the students building compression members (beams) and tension members (cords) and gussets to better model real world designs and to give the students the opportunity to learn and make decisions about which members to use in different parts of their own designs.

The only issue that we had with this project is that it requires the rather tedious process of having students trace out the unfolded beam designs onto file folder material and then use scissors and  blades to cut out each beam and cord. But we have a laser cutter! There had to be a way to incorporate both 3D CAD design and our laser cutter in order to modernize this process. We also knew that Autodesk Inventor had some really amazing tools for analyzing design structures.

From Sheet Metal To Manila Folders

Autodesk Inventor has an amazing set of tools for designing sheet metal parts. Using these tools, an engineer can construct 3D models made of folded metal parts made from just about any thickness of metal stock. Once you have designed the folded metal part, Inventor will create a flat pattern design for you that you could then send to a CNC plasma cutter to cut from sheet metal stock. You would then fold the part up manually and you would have your folded part.

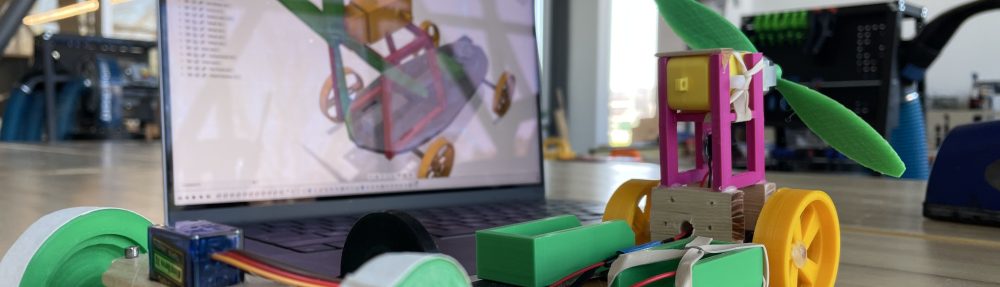
Inventor gives you the ability to custom define the thickness of your stock, and some of the parameters around how it can be bent. We defined our stock to be as thick as manila folder paper. The next step is a bit tricky, but with the help of a great video I came across from Rob Cohee, we were able to define custom folded paper beam stock that the students could then use to build out their frames. Once again, Inventor has an amazing set of tools for defining structural frames (called The Frame Generator) that can then be populated with any kind of structural beam. You can also define your own structural beams that can be used to populate your frame.

I have included a video below that we use with the students to help guide them through this process:

Using the frame generator tool in Inventor also allows the student to miter and trim the beam members, which allows the students to focus on design rather than getting lost in the time consuming process of calculating the cut angles. The following video shows you how this can be done:

Once the students had designed the bridges, it was time to prepare the flat patterns and have the laser cutter do the work of cutting them out.

Fold, Glue, Repeat. (Some Assembly Required)

IMG_0353

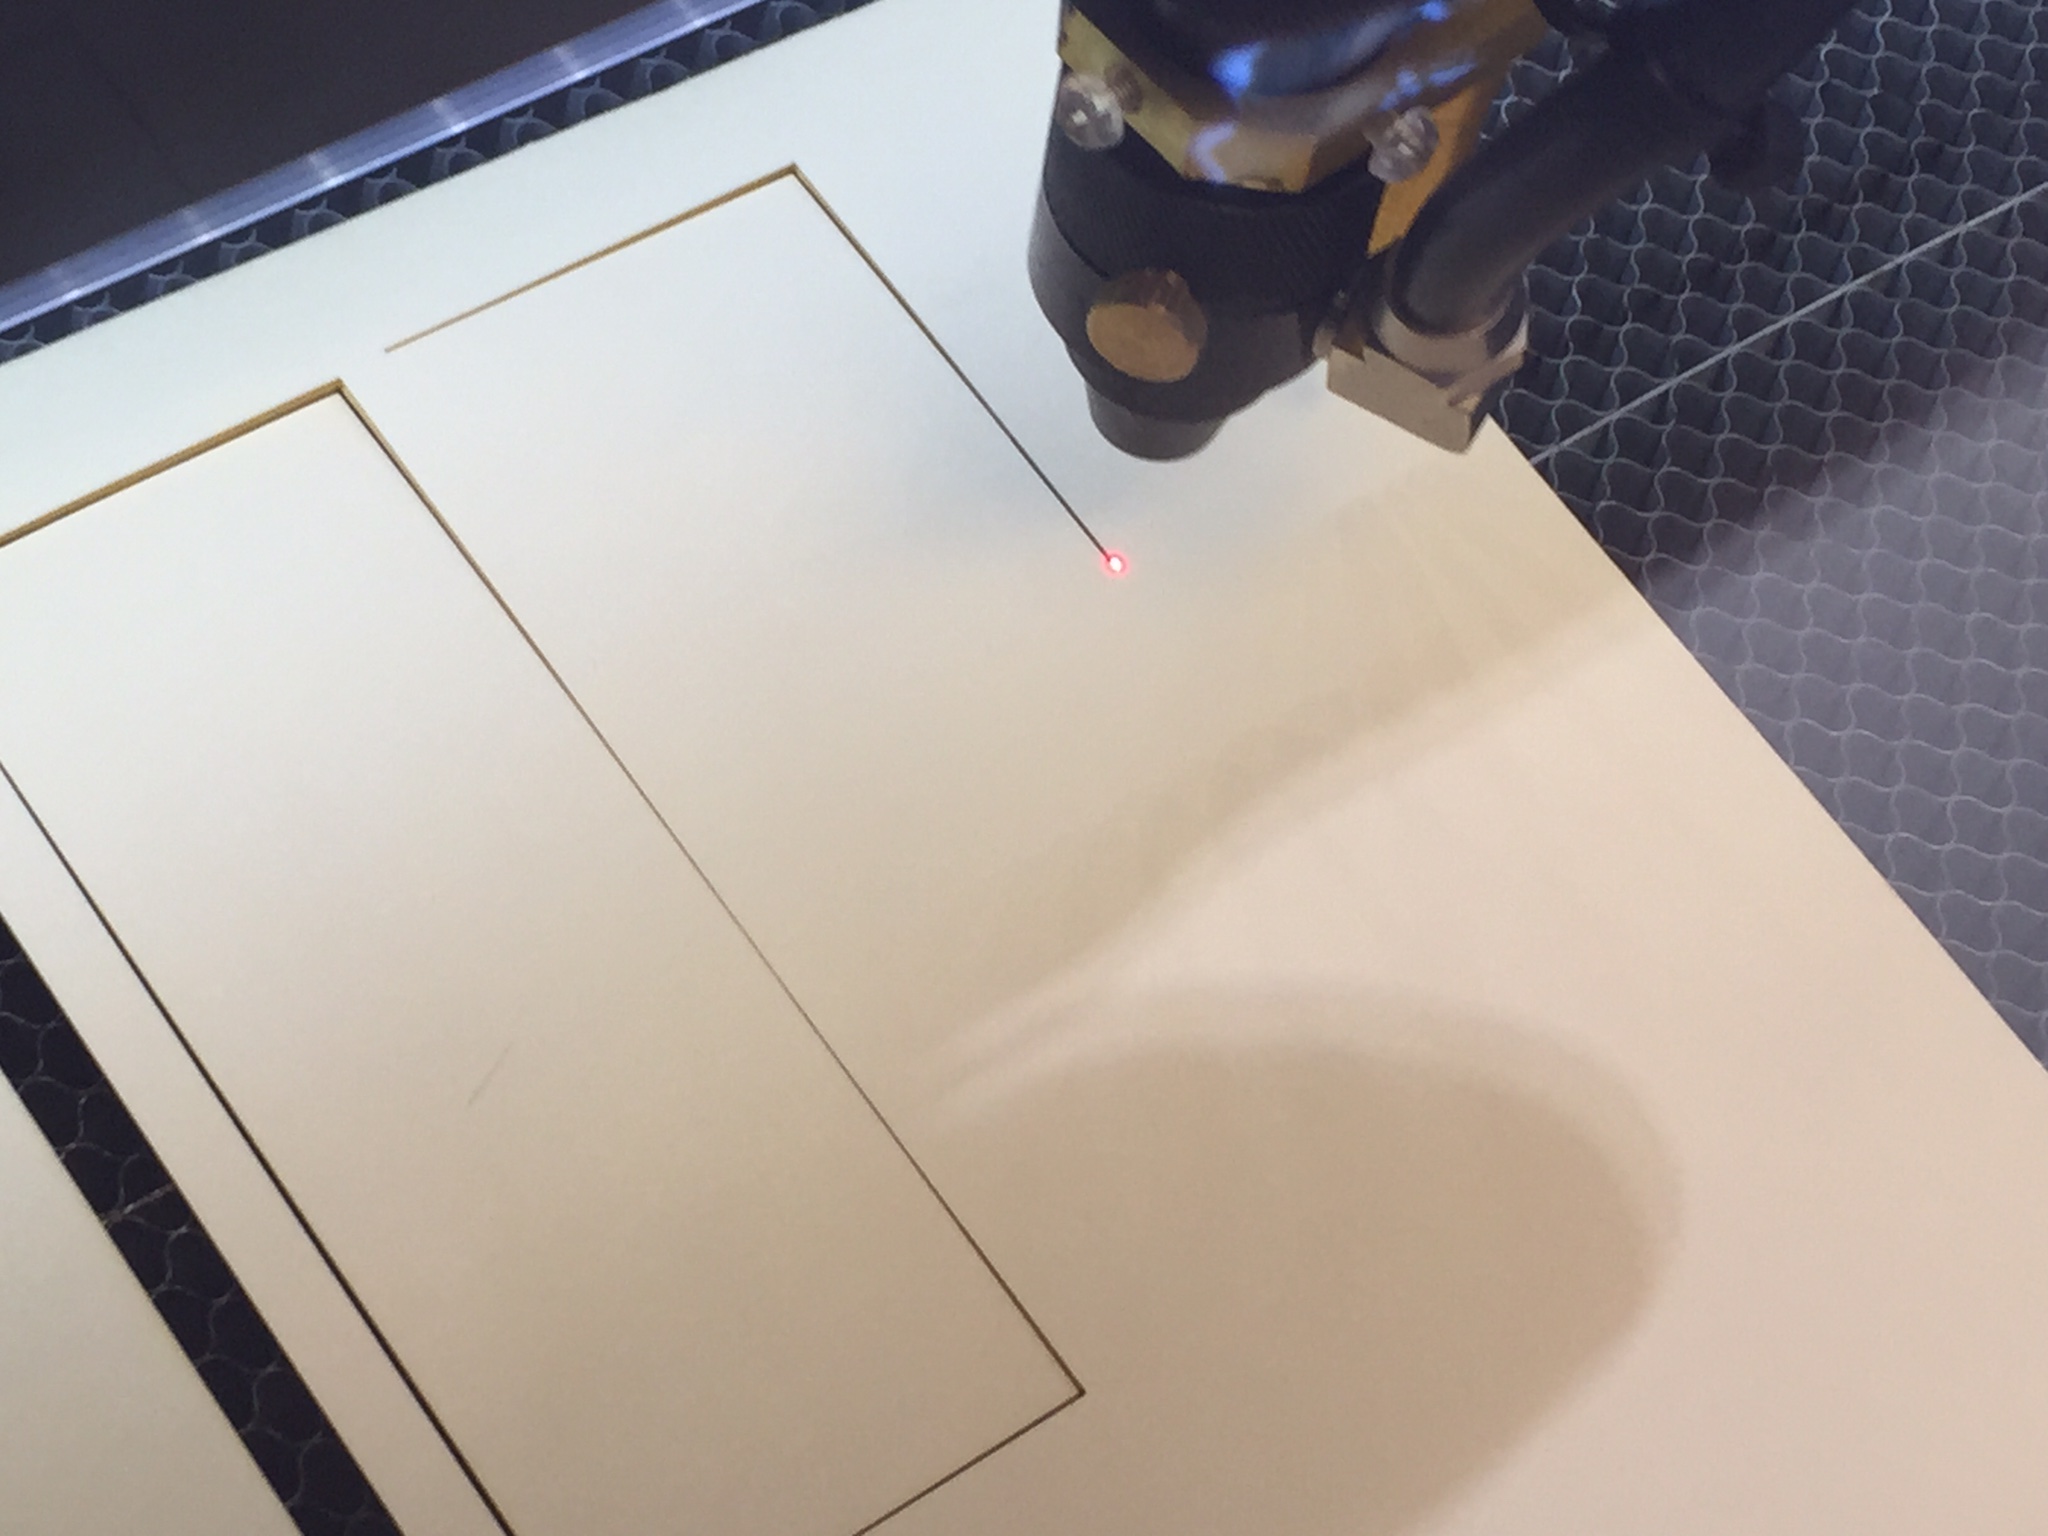
The students prepare their flat pattern cut-outs for the laser cutter and then you let the laser “rip”! Its awesome to sit back and watch this machine cut. I never get sick of watching it! Having the students do this would take SO much longer, the cut parts would be less accurate, and as all CTE teachers know, one of the most dangerous tools in the shop is an Exacto blade.

IMG_0355

Some might argue that the “manual” process of cutting all these beams out by hand is “good for the students”, but we feel that saving time here allows us to use that time in other areas, such as virtual testing.  Before the students get to build their design, we ask them to use Inventor’s frame analysis tools to help them analyze potential weaknesses in their designs. The following video shows just how amazing this tool is:

Once the students have done their analysis and cut their construction members, its time for folding and gluing, and folding, and gluing, and … At this point our project does not differ from the Engineering Encounters project. The students use a sheet of paper (actually two 11 x 17 sheets) with an elevation view (printed from Inventor as a CAD drawing) glued to a board as a guide for assembling the beams, cords and gussets:

IMG_0351

IMG_0362

This process goes relatively quickly as the students have done all the prep work to make sure that the pieces all fit together. Once again, this really demonstrates how modern technology can allow the students to focus their attention on design.

To Break Or Not To Break

Once the bridges are assembled, its time to test them out. The performance metrics for the contest are not actually based on the strongest bridge but rather a more realistic approach. We have attached a monetary value to each beam, gusset and cord. The bridges are then tested to a set value – the required load. The bridge that holds that load and is “manufactured” least amount of money is then given the highest marks.

Once the bridge has been tested at the required load, we then give the students the choice to see just how much the bridges can hold before catastrophic failure. Most students (encouraged by both peers and staff!) decide to take their bridge to the limit.

Its always a fun way to end the project!

We Have Lift Off!

15414703973_b0258a08ca_h  15846865828_b08d8515cd_h 16033503742_be978fd9ca_h

This is a follow up post to Modeling A Rocket’s Journey – A Synthesis where I described how the students in the first year program were engaged in creating a predictive report for their model rockets. I want to emphasize that these model rockets were not kits. Each rocket was designed using 3D CAD software, and each component was either fabricated from raw material, or was created from material that was not intended for use in model rocketry. The only exception to this is the actual rocket motor.

The next step was to launch the rockets and have the altimeter payload collect altitude data.

Launch Conditions – A Bit Soggy

Unfortunately the week of our scheduled launch happened to be a week of some pretty hefty rains. We rescheduled the launch twice before finally accepting the soggy launch conditions. With umbrellas and rain jackets, we trudged out to the baseball diamond and got to work setting up for the launch. We had some minor difficulties in the wet weather, but eventually had a very successful launch day.

Most of the rockets were able to launch and deploy their valuable payload – the Pnut Altimeter.

15414689283_8197c70584_h

The students seemed very excited to finally see the rockets launch, and to see the successful deployment of the parachutes. Although we all got a little wet and muddy, we had a great time!

The Altimeter Data

The altimeters use a small barometric pressure sensor to collect altitude data (the altimeters also contain a small temperature sensor and voltage sensor). The altitude is recorded in feet every .05 seconds. Here is an example of one rocket’s recorded flight data:

altitude_vs_time

https://plot.ly/~stemples/9

The students were then asked to use the data to create a comparative analysis report. I will detail how the assignment was set up and also discuss how the students performed on this assignment. That will be for another post.

I want to also thank Mr. Kainz for his amazing photos that are displayed here.

Building The Net Force Particle Model (Part 1)

From “The How” to “The Why”:

One of the three projects that the students will complete this year is a custom designed and fabricated rocket. One of the requirements of this project is for the rockets to carry a small solid state altimeter that collects vertical position data. This year I decided to give the students some data collected by last year’s students. Here is what the data looks like from one typical altimeter reading:

Rocketdata2013

As an introduction to this next model, I presented them with the data and asked them to use both the Constant Velocity Particle Model and the Constant Acceleration Particle Model to describe the motion of the rocket based on the data. Students responded to several questions that I created and they posted their answers through the Learning Management System we use.

A Simple Definition, A Simple Representation

The student investigation teams were then asked to draw velocity vs time graphs on their whiteboards. I was impressed to see that most teams were able to interpret the position data and create a velocity graph that agreed with the data. There was some debate about the graphs, but the students worked through these differences and came to consensus around what the graph would most likely look like. At this point I was thinking about using LoggerPro’s ability to graph the derivative of a data set, but decided that I would leave that for a later date, though next year I might do it earlier.

I then introduced a very basic definition of a force:

“A Force is A Push or A Pull”

And then I proposed that we could represent the force with an arrow, just as we had done with velocity and acceleration. I then asked them to divide the rocket data into four sections based on the answers to the questions we had discussed. The students then drew a representation of the rocket in each stage and the forces acting on the rocket. The stages the students identified were 4) on the ground, 3) descending by parachute, 2) going up without fuel, and 1) going up with fuel. I asked them to draw the diagrams by starting at the end. Here is a typical example of the force diagrams the students drew:

photo 2

The labeling is a standard that is outlined in the Modeling methodology – it reads (type, feeler, dealer).

Constant Velocity Motion and Net Force

We started the class discussion by looking at the forces acting on the rocket when the rocket was on the ground. Students agreed unanimously that there were two forces acting on the rocket – one down, one up – the gravitational force and then the force from the ground. Great. Then on to the descent phase. Certainly less unanimity here. The students again agreed on the number of forces – two – one up from air resistance, one down from gravity. The students quickly got into several back-and-forth arguments about the length of the force vectors. The class was split. Were the forces equal? Or, was gravity “winning”? The big stumbling block was around the question, “if gravity was equal to the air resistance force, then why was the rocket still falling”? A classic example of Aristotelian thinking. I encouraged them to ask the question – “if gravity was winning, why wasn’t the rocket speeding up?” One student proposed that maybe the force of gravity was just ever so slightly larger. Some students pounced in this. They argued that the forces weren’t equal at first, but as the rocket (with parachute) descended, the air resistance force strengthened and eventually became as strong as the gravitational force. the reason the rocket didn’t slow down was because it was already moving when the forces became equal. Awesome. Then a student gave an excellent description of a thought experiment where a box was traveling through space in one direction and convinced the students that the box would not slow down if you pushed equally on both sides of the box. Students reached consensus – the rocket moved at a constant velocity because the forces were equal.

The “Residue” Misconception

We then progressed to the next stage. Things got really interesting. Without exception, ALL the student groups identified an arrow pointing upward, even though they all agreed that the fuel had run out. The question that I think cuts through this the quickest is to ask “who is pushing on the rocket upward?” Most students get that funny look on their faces as their brains begin to realize that they just ran into a logical conundrum. Some students start to respond – “the rocket pushes the rocket.” OK, how? What kind of force is it? A contact force? How does it push or pull itself? The students at this point began to question each other and the room erupted in arguments. Being a bit of a control freak, I’ve had to learn to allow space and time for these chaotic moments, but also realize the importance of catching the class before it descends into something less productive.

At this point, one group erased the upward force. I asked them why they had done this. They responded that they didn’t think a force was needed for the rocket to continue upward, and that gravity and air resistance were slowing the rocket down. This seemed impossible to some of the students. They asked – “but something is left over after the fuel runs out, isn’t there?” The class began to divide up into those that now believed the rocket no longer had any upward force acting on it and those that believed there was some kind of “left-over” force, what I call a “residue”. So, once again, I asked them to identify the dealer of the residue force. The answer is generally – “the fuel”. Ah, but hasn’t the fuel run out? Yes, but the rocket has gained something from the fuel and now that is what is pushing it upward.

This is not such a wild idea, and in fact is not that far from the idea of Kinetic Energy. The students that were in the “no upward force” camp started to explain to the other students in the class that the fuel had “given” the rocket its upward velocity, but now that the fuel was gone, the rocket was now slowing down. We discussed the idea that anything that was slowing down must be experiencing a force pushing in the opposite direction of its velocity. We returned to the thought experiment with the box floating through space. The students debated about whether this box would slow down if the force that had gotten the box moving in the first place disappeared. The students agreed that if there were no forces acting on it to slow it, then it was reasonable to say that it would never slow down. Students then agreed the rocket was no different. It didn’t need a force to continue moving at a constant velocity, but that if it was instead accelerating (in this case in the negative direction) then it would need a force, which was provided by gravity and the air resistance force.  The students began to coalesce around the idea that if a force was a push or a pull, then the rocket that had run out of fuel was not getting pushed any longer, and that although it was moving upward it was indeed accelerating downward.

Making Some Observations

During the next class, I had the students set up a motion detector on one side of a Vernier dynamics track and use a force meter to pull on a low friction cart. They were to also record the velocity of the cart while the students pulled twice in quick succession on a string connected to the cart and force meter.

IMG_0686

The students then shared their graphs with the rest of the class:

IMG_0687

This experiment is meant to re-enforce some of the arguments made during the previous class. The students quickly see that the velocity is measured to change when the force is applied and that the velocity is “constantish” when no force is applied. The students were ready to tackle how the force and acceleration were quantitatively related, but that’s for another post…